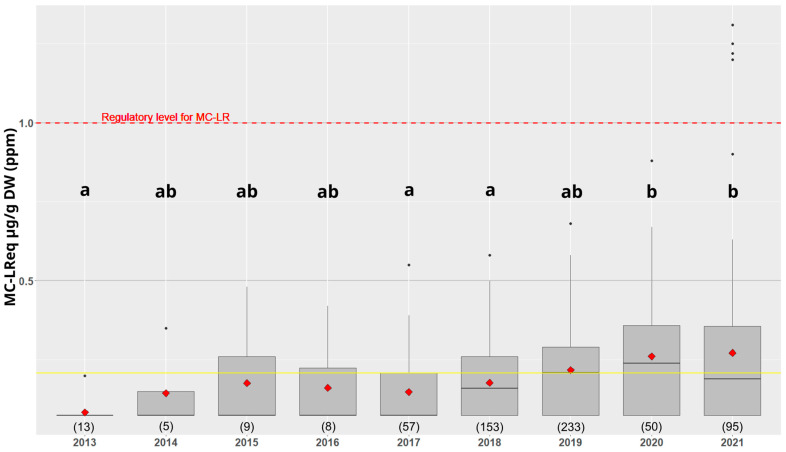
Figure 1.
Microcystin-LR equivalent (MC-LReq) in dry spirulina products detected with ELISA assays between 2013 and 2021. The boxplot represents the dispersion of the MC level, the yellow line represents the mean over the years and the red diamonds represent the annual averages. The number of samples per year is indicated between the brackets. The letters a, b and ab group together the data series of which the means are not significantly different (Tukey’s test).

