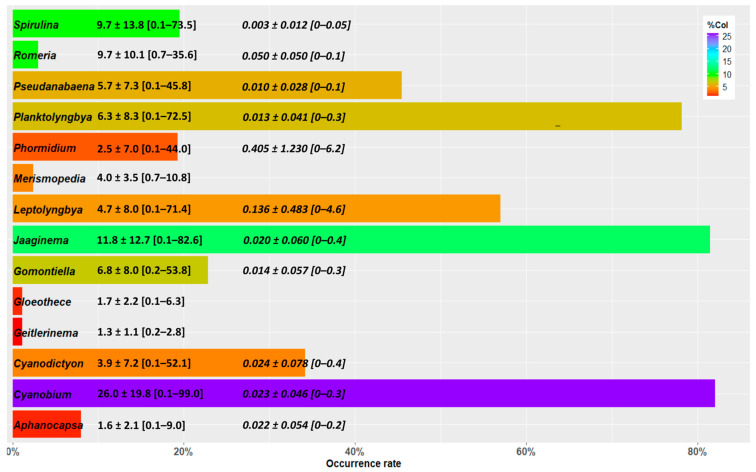
Figure 4.
Cyanobacterial contaminants genus in spirulina cultures and dry products samples from 2017 and 2019 to 2021 (n = 539 samples). The length of the bars represents the occurrences of observations of each genus. Their color represents the average percentage of colonies (%Col) observed. The numbers following the genus names are relative to the percentages of the colonies observed—the mean ± SD [min.–max. values]—and, in italics, the percentages of biovolumes when available.

