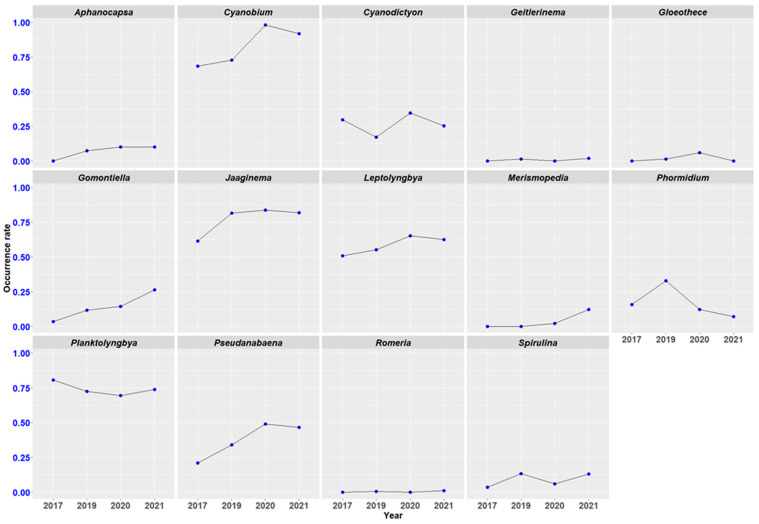
Figure 5.
Interannual evolution of the occurrence rate of cyanobacterial contaminants in dry spirulina. Number of samples per year: 2017 (n = 57), 2019 (n = 232), 2020 (n = 49), 2021 (n = 99). The 75 farms located in our dataset are spread over the entire territory of mainland France, with a predominance in the South, Southeast and West regions. No geographical trend is observed for the taxonomic diversity of cyanobacterial contaminants which ranges from 3 to 11 taxa (genus) per farm, with an average between 6 and 7 genera. The cyanobacteria most often identified in our samples have a wide geographical distribution (Figure 6).

