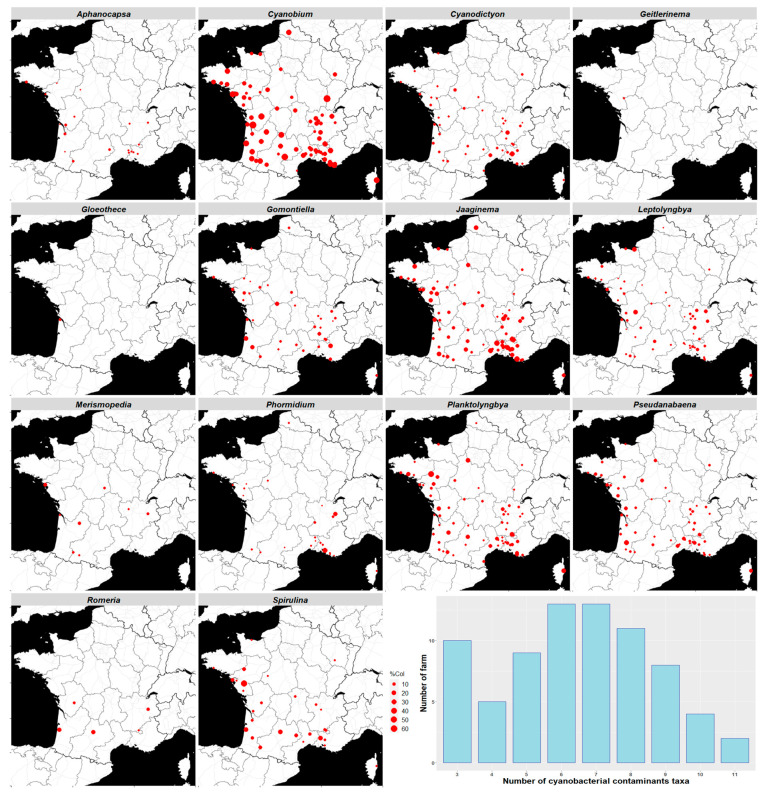
Figure 6.
Geographical distribution of cyanobacterial contaminants. The red dots indicate the farm location where the cyanobacteria have been identified. The size of the dots is proportional to the average percentage of the colonies of the different cyanobacteria in each farm. n = 75 farms. The histogram represents the distribution of the numbers of cyanobacterial contaminant taxa per farm (mean = 6.48).

