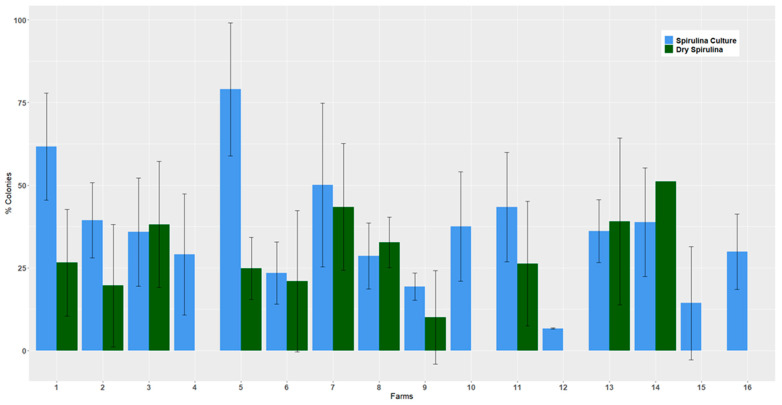
Figure 8.
Evolution of Cyanobium from cultivation to harvested product. The bars represent the means of the relative abundances of Cyanobium colonies, expressed as a percentage of total cyanobacteria, respectively, in the samples of spirulina cultures (n = 100) and the products harvested (dry spirulina, n = 57) for 16 farms.

