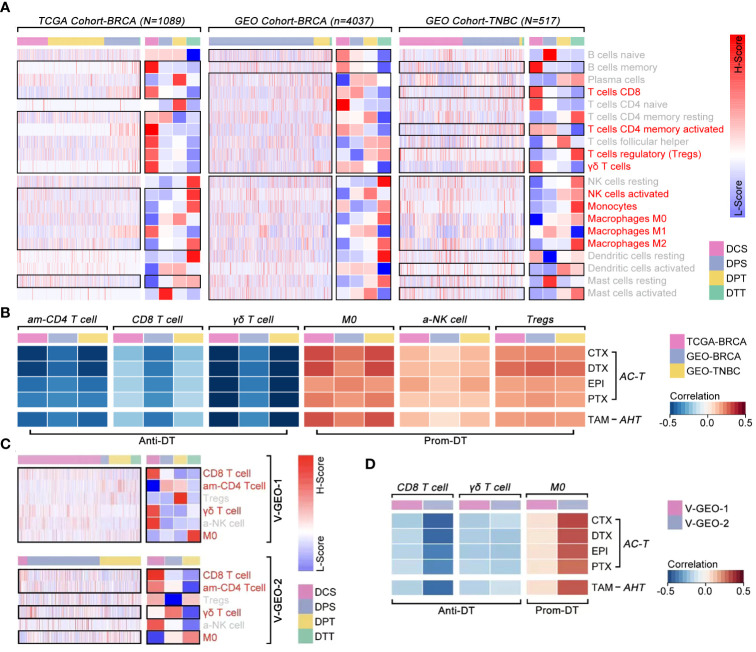
Figure 9.
The correlation between immune cell infiltration and drug sensitivity. (A) Differences of ICI amongst ICD subgroups, in which T cell CD8, T cell CD4 memory activity, Tregs, γδ T cell, NK cell activated, monocytes, macrophages M0, macrophages M1 and macrophages M2 held different infiltration proportion in BRCA (p<0.05) (data from TCGA, GEO cohort-4037 and GEO cohort-TNBC). (B) Pearson test identified T cell CD4 memory activity (am-CD4 T cell), T cell CD8 (CD8 T cell) and γδ T cell were negative correlated with drug score (p<0.05), while macrophages M0 (M0), NK cell activated (a-NK cell) and Tregs were positive correlated with drug score (p<0.05) (data from TCGA, GEO cohort-ALL and GEO cohort-TNBC). (C) Differences of ICI amongst ICD subgroups, in which CD8 T cell, am-CD4 T cell, γδ T cell and M0 held different infiltration proportion in BRCA (p<0.05) (data from GEO cohort-1 and cohort-2). (D) Pearson test identified CD8 T cell and γδ T cell were negative correlated with drug score (p<0.05), while M0 was positive correlated with drug score (p<0.05) (data from GEO cohort-1 [n=488] and GEO cohort-2 [n=1578]).

