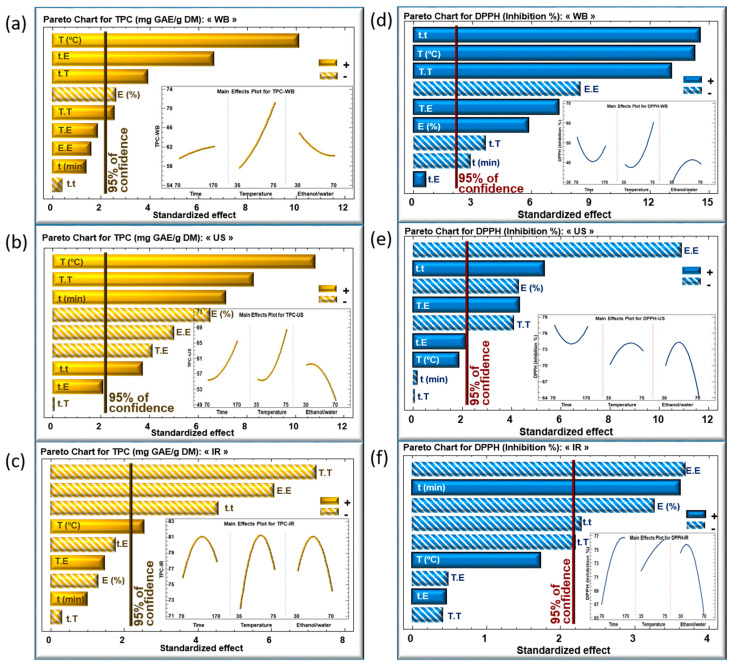
Figure 3.
Standardized Pareto charts of TPC and DPPH inhibition percentage using WB (a,d), US (b,e) and IR (c,f) extraction techniques of Centranthus longiflorus stems. The variables studied are extraction time “t”, extraction temperature “T”, and solvent mixture “E”. The vertical line indicates statistical significance with more than 95% of confidence. (+) indicates a positive effect, (−) indicates a negative effect.

