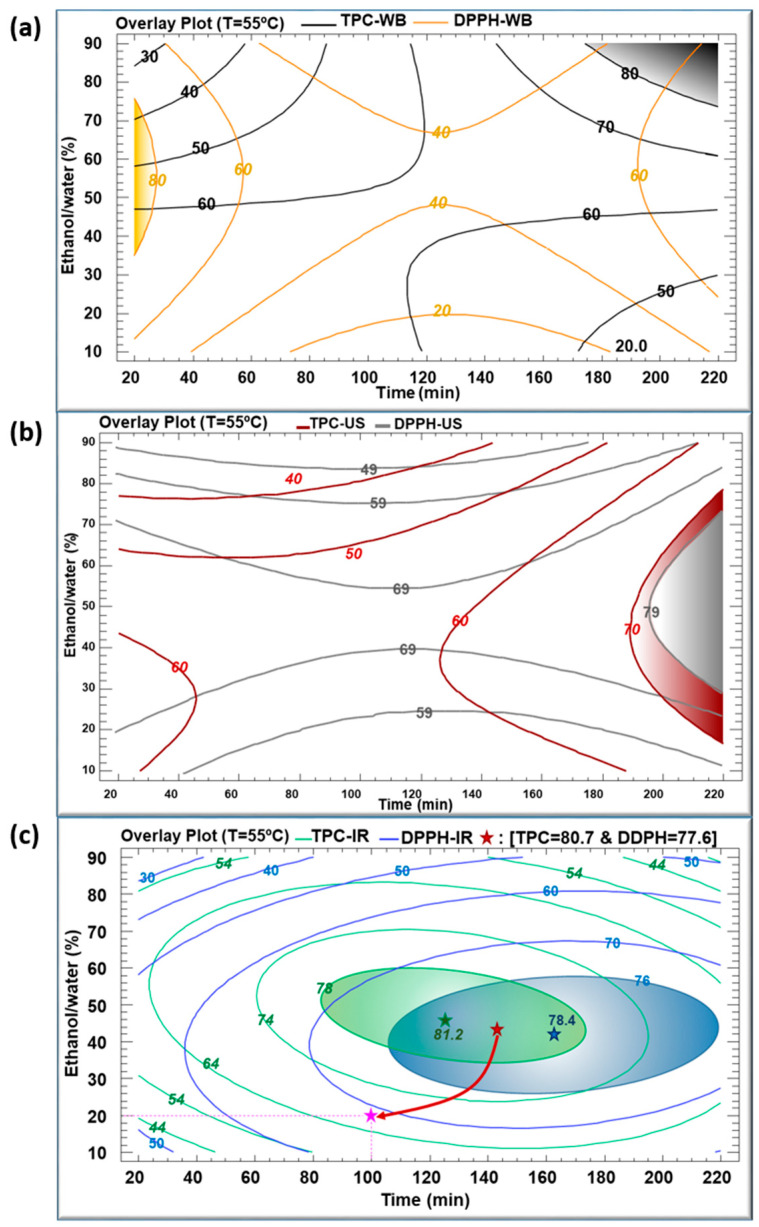
Figure 5.
The overlay plots of the multiple response of all parameters using WB (a), US (b) and IR (c) extraction techniques of Centranthus longiflorus stems. The colored lines indicate the value of TPC and DPPH inhibition. Green star, blue star and red star represent the optimum of TPC, the optimum of DPPH, and the multiple optimum, respectively, for the IR extraction method.

