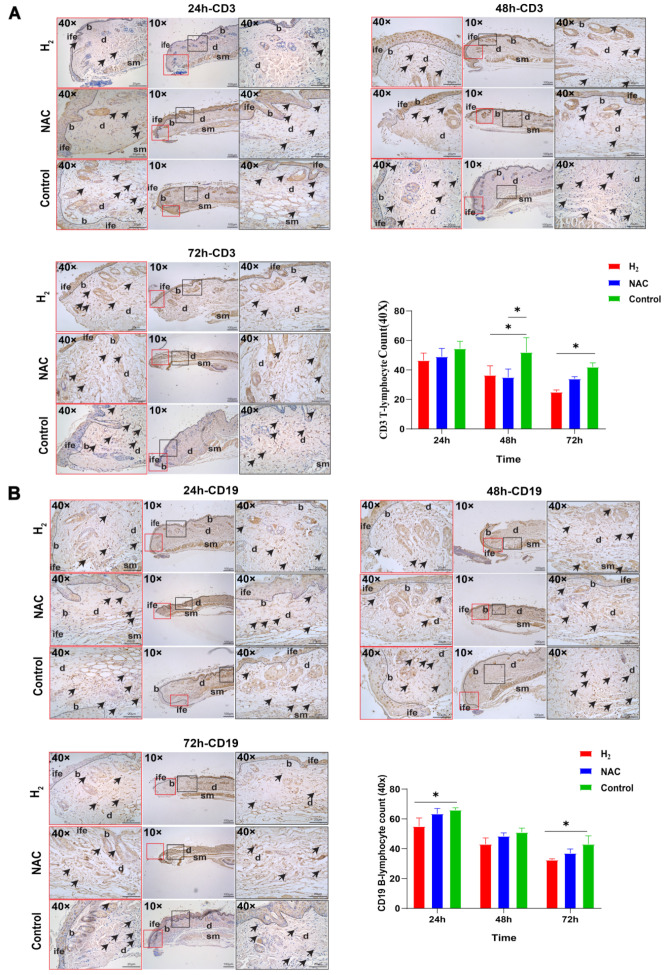
Figure 2.
IHC staining revealed T-lymphocyte (CD3) and B-lymphocyte (CD19) infiltration in the proximal skin tissue during the first three days after wounding. (A) T-lymphocyte (CD3) IHC staining results. Black arrows indicate infiltrating T-lymphocytes. Magnification is indicated in the figure. Statistical analysis of the number of wound-infiltrating T-lymphocytes (objective 40×). (B) B-lymphocytes (CD3) IHC staining results. Black arrows indicate infiltrating B-lymphocytes. Magnification is indicated in the figure. Statistical analysis of the number of wound-infiltrating B-lymphocytes (objective 40×). wb: wound bed, b: basal layer, d: dermis, sm: smooth muscle, ife: epidermis. Data were analyzed via two-way ANOVA and plotted as mean ± SEM. * p < 0.05.

