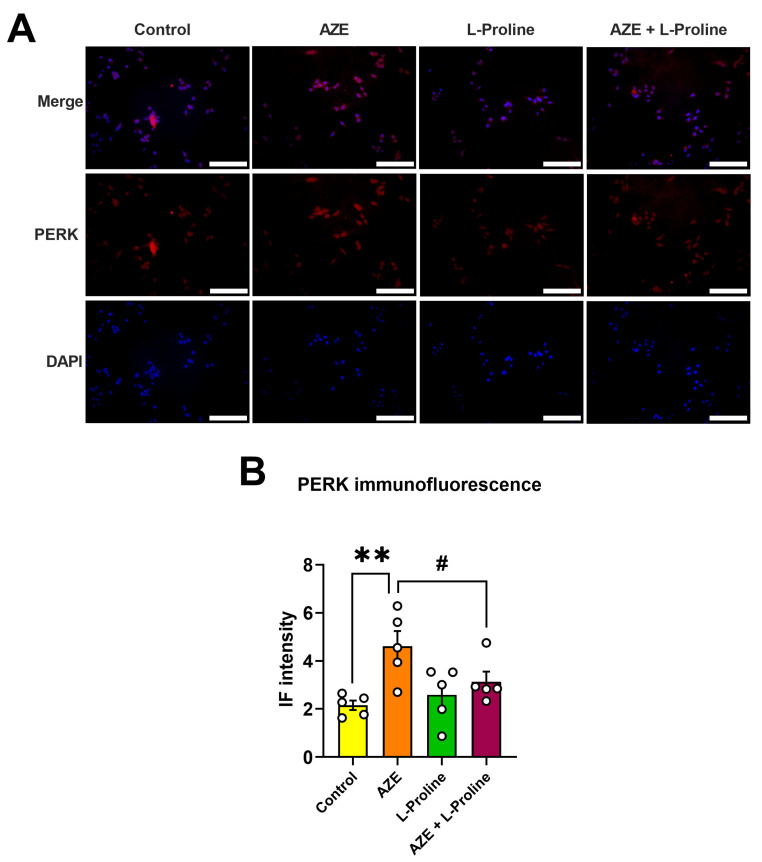
Figure 5.
Effects of AZE treatment on PERK expression are prevented upon L-proline co-administration in BV2 microglia. (A) Representative photomicrographs showing PERK immunofluorescence (IF) and (B) related IF quantification of untreated cells (control) or following exposure to AZE (1000 µM), L-proline (50 µM) or their combination after 24 h. Images were taken on an Olympus BX51 Fluorescence Microscope using the 20× objective. Scale bar = 60 µm. (B) PERK immunofluorescence intensity was determined using NIH ImageJ version 1.52. At least five independent images (n = 5) were analyzed for each experimental condition. Results shown are the mean ± SEM. ** p < 0.01 vs. control or # p < 0.05 vs. AZE. Statistical significance was computed using a one-way ANOVA, followed by Tukey post hoc test. IF = immunofluorescence; Aze = L-azetidine-2-carboxylic acid; PERK = protein kinase R-like endoplasmic reticulum kinase.

