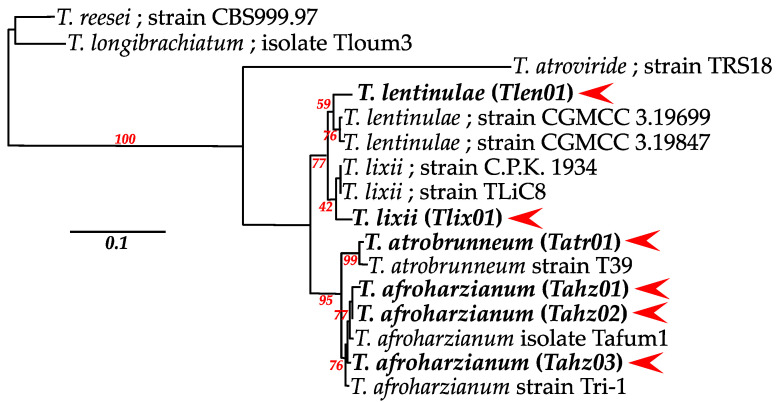
Figure 1.
ITS-tef1-rpb2 based molecular phylogenetic analysis of the six Trichoderma spp. isolates (red triangle) with closed sequences retrieved from NCBI. The analysis was generated using the maximum likelihood analysis implemented in the PhyML program. Values of the bootstrap analysis (1000 repetitions) are given at the nodes. Bar 0.1 corresponds to the nucleotide substitution per sequence position. Each new strain is labeled with an acronym (e.g., Tahz01, Tahz02, etc.) that will be used throughout the article.

