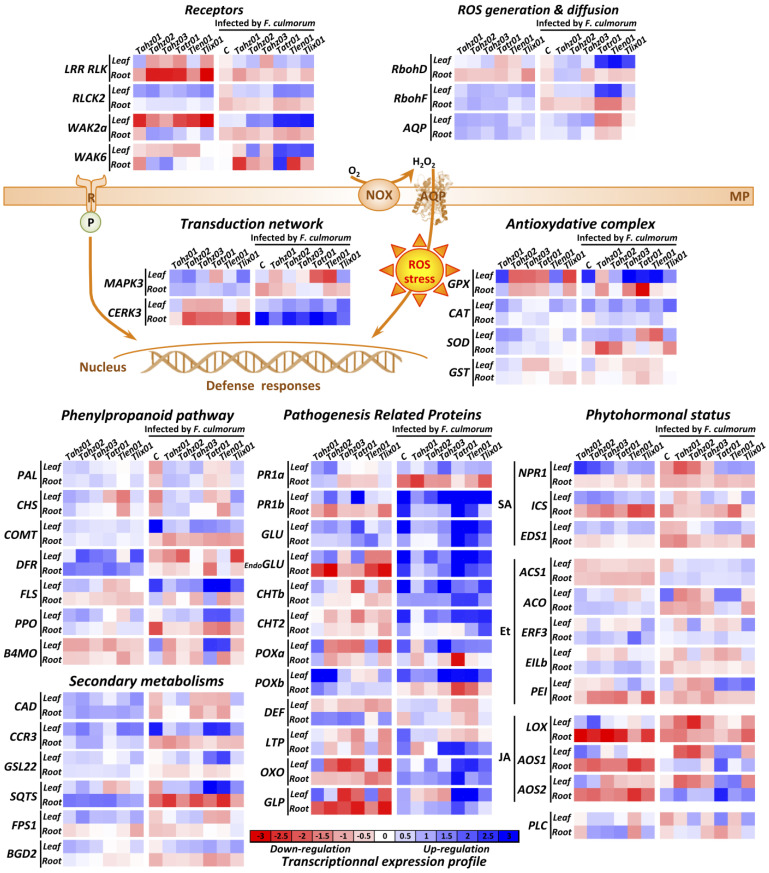
Figure 7.
Defense-related gene modulation in wheat roots and leaves following fungal inoculations with Trichoderma isolates alone or in combination with F. culmorum. Organs sampled for molecular analyses came from plants used for physiological and morphological analyses. Transcript levels for each gene were estimated using real-time qRT-PCR analyses and normalized by the expression of three housekeeping genes. Relative transcript abundance rates were obtained by the 2−ΔΔCT method. Data correspond to the mean of three independent biological experiments; each biological repetition corresponds to a mix of 5 plants. Colors represent the levels of transcriptional expressions (blue, up-expression; red, down-expression, compared with healthy samples treated with sterile PDB). NOX, NADPH oxidase; AQP, Aquaporin. Statistical analyses were detailed in Table S2 in Supplementary Materials. Gene acronyms and related primers used for qPCR amplification are given in Table S1 in Supplementary Materials. SA, salicylic acid; Et, Ethylen; JA, Jasmonates.

