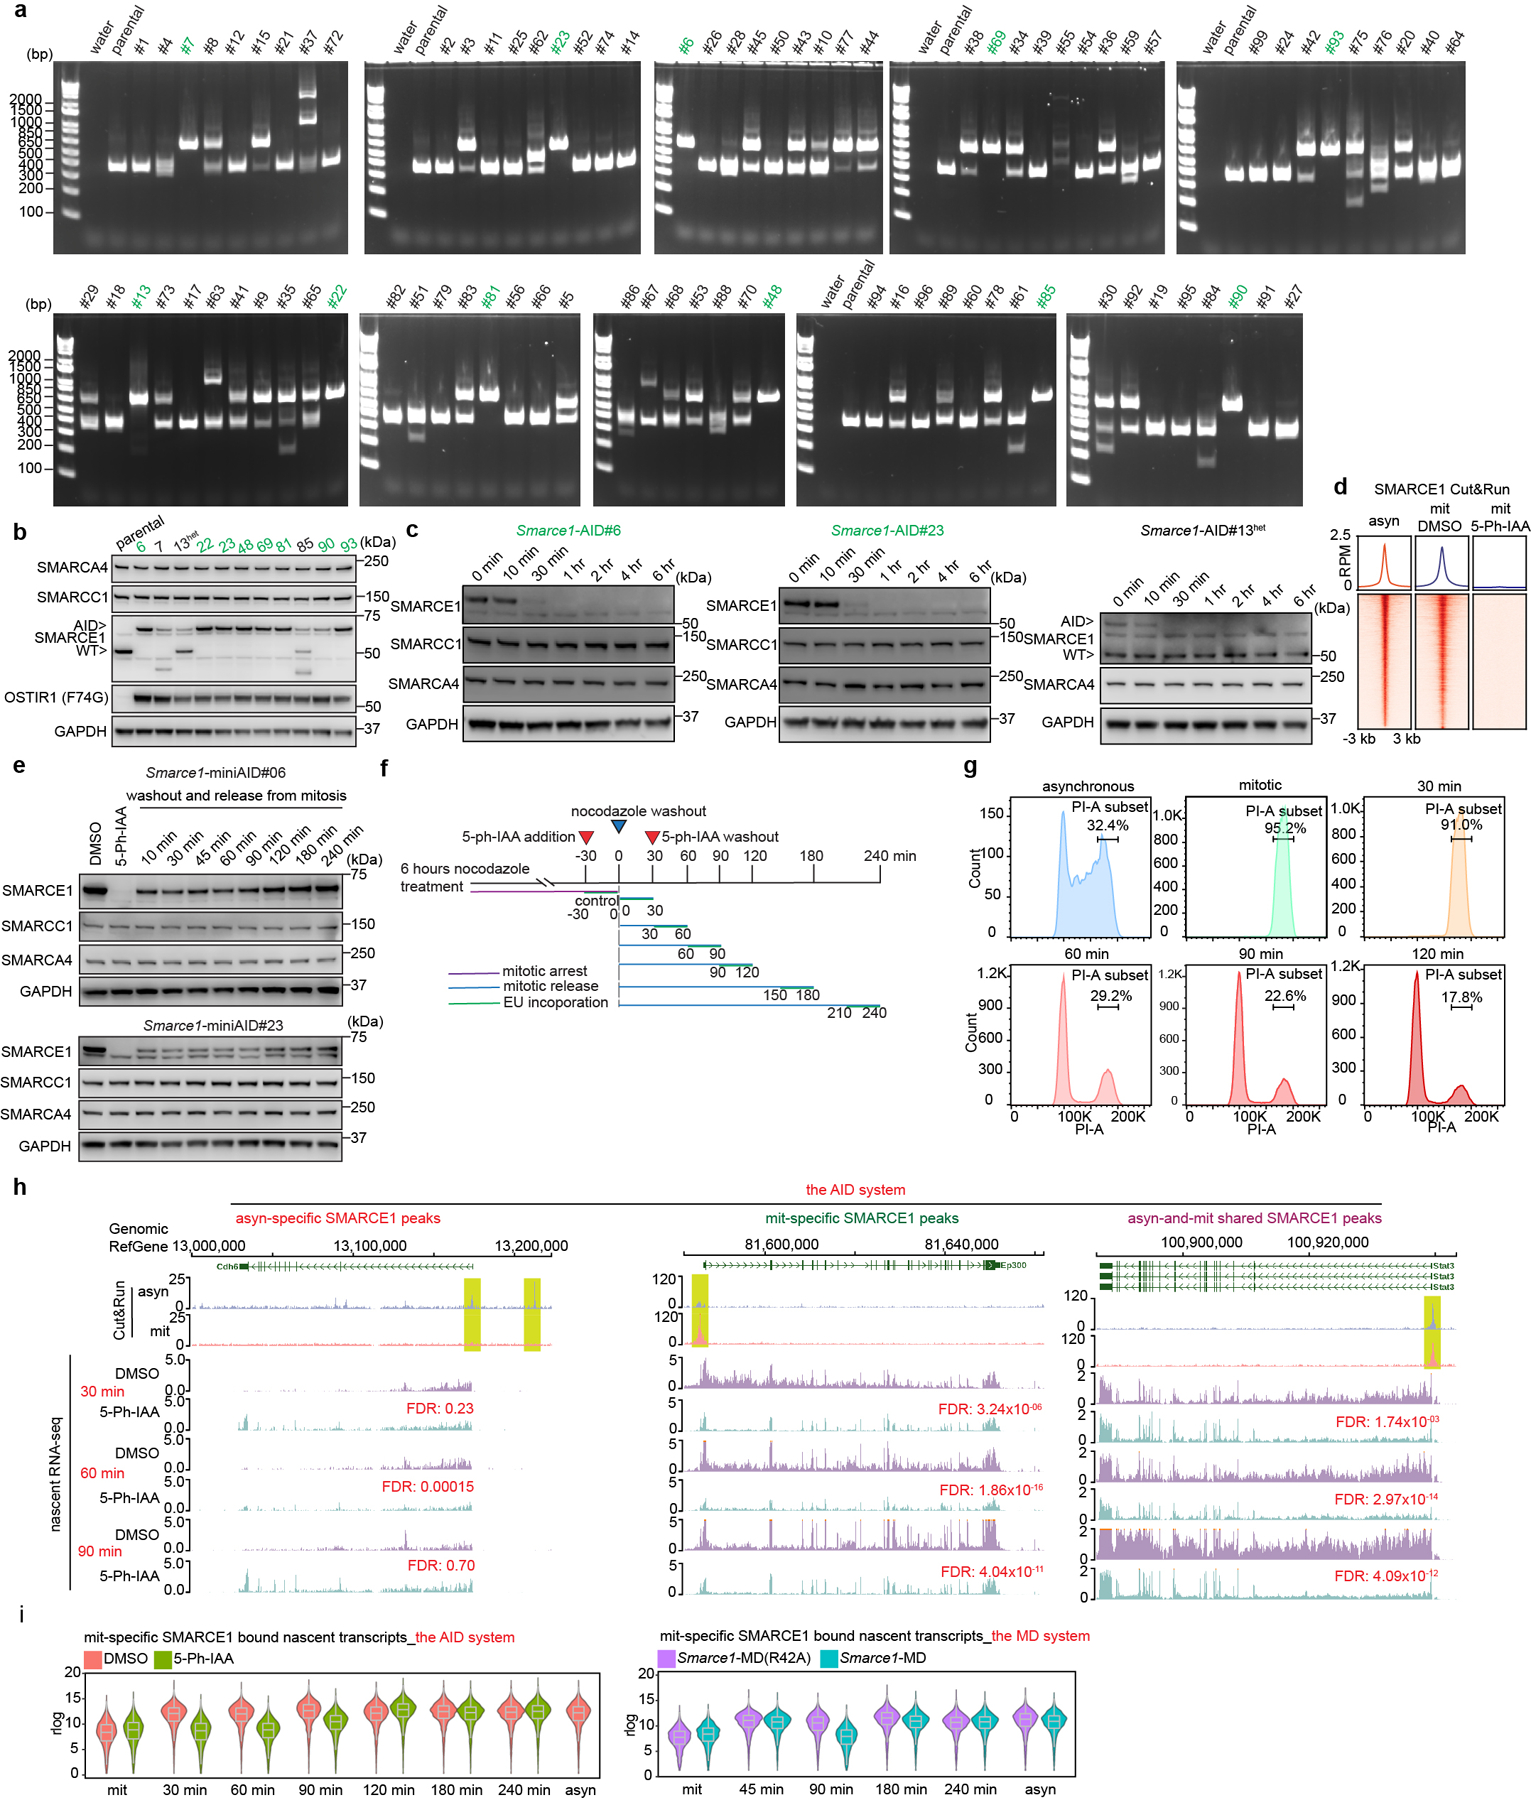
Extended Data Figure 7. Generation and characterization of endogenous auxin-inducible degradation (AID) degron fused to SMARCE1 in mouse ES cells.

a, PCR-base genotyping assay validating the generation of Smarce1-AID homozygous knock-in mouse ES cell lines (green). b, Representative immunoblot showing the protein levels in the homozygous knock-in clones from (a); clone 13 is a heterozygous one (#13het), clone 7 and clone 85 are off-target edited. c, Representative immunoblot in Smarce1-AID clones #6, #23, and #13het treated with 1 μM 5-Ph-IAA for the indicated time following release from mitotic arrest. GAPDH was used as a loading control. d, Average binding profiles of SMARCE1 Cut&Run signal in asynchronous Smarce1-AID cells (clones #6 and #23) and mitotic cells treated with DMSO or 1 μM 5-Ph-IAA for 1 hour. e, Representative immunoblot in mitotic Smarce1-AID cells (clones #6 and #23) treated with DMSO or 1 μM 5-Ph-IAA for 1 hour (lanes 1 and 2) and in cells that underwent washout and release from mitotic arrest for the indicated time periods. f, Schematic for EU-pulse-labeling of newly synthesized transcripts and 5-Ph-IAA treatment during mitosis and mitotic release in the AID degron system. g, Representative flow cytometry plot showing DNA contents of asynchronous cells, synchronized mitotic cells, and cells released from mitotic arrest for the indicated time. h, Representative SMARCE1 peaks and associated nascent RNA profiles in DMSO and 1μM 5-Ph-IAA treated Smarce1-AID (clones 6 and 23) mouse ES cells at 30 min, 60 min and 90 min after mitotic release. i, Violin plot showing the nascent transcriptional levels of genes bound by mitosis-specific (gained) SMARCE1 in asynchronous and mitotic cells and cells released from mitotic arrest in the AID system (left) and in the MD system (right). Center lines denote medians; box limits 25th- 75th percentile; whiskers 5th- 95th percentile. Data are representative or compiled from one (a) or two replicates (b, c, d, e, g, h, i).
