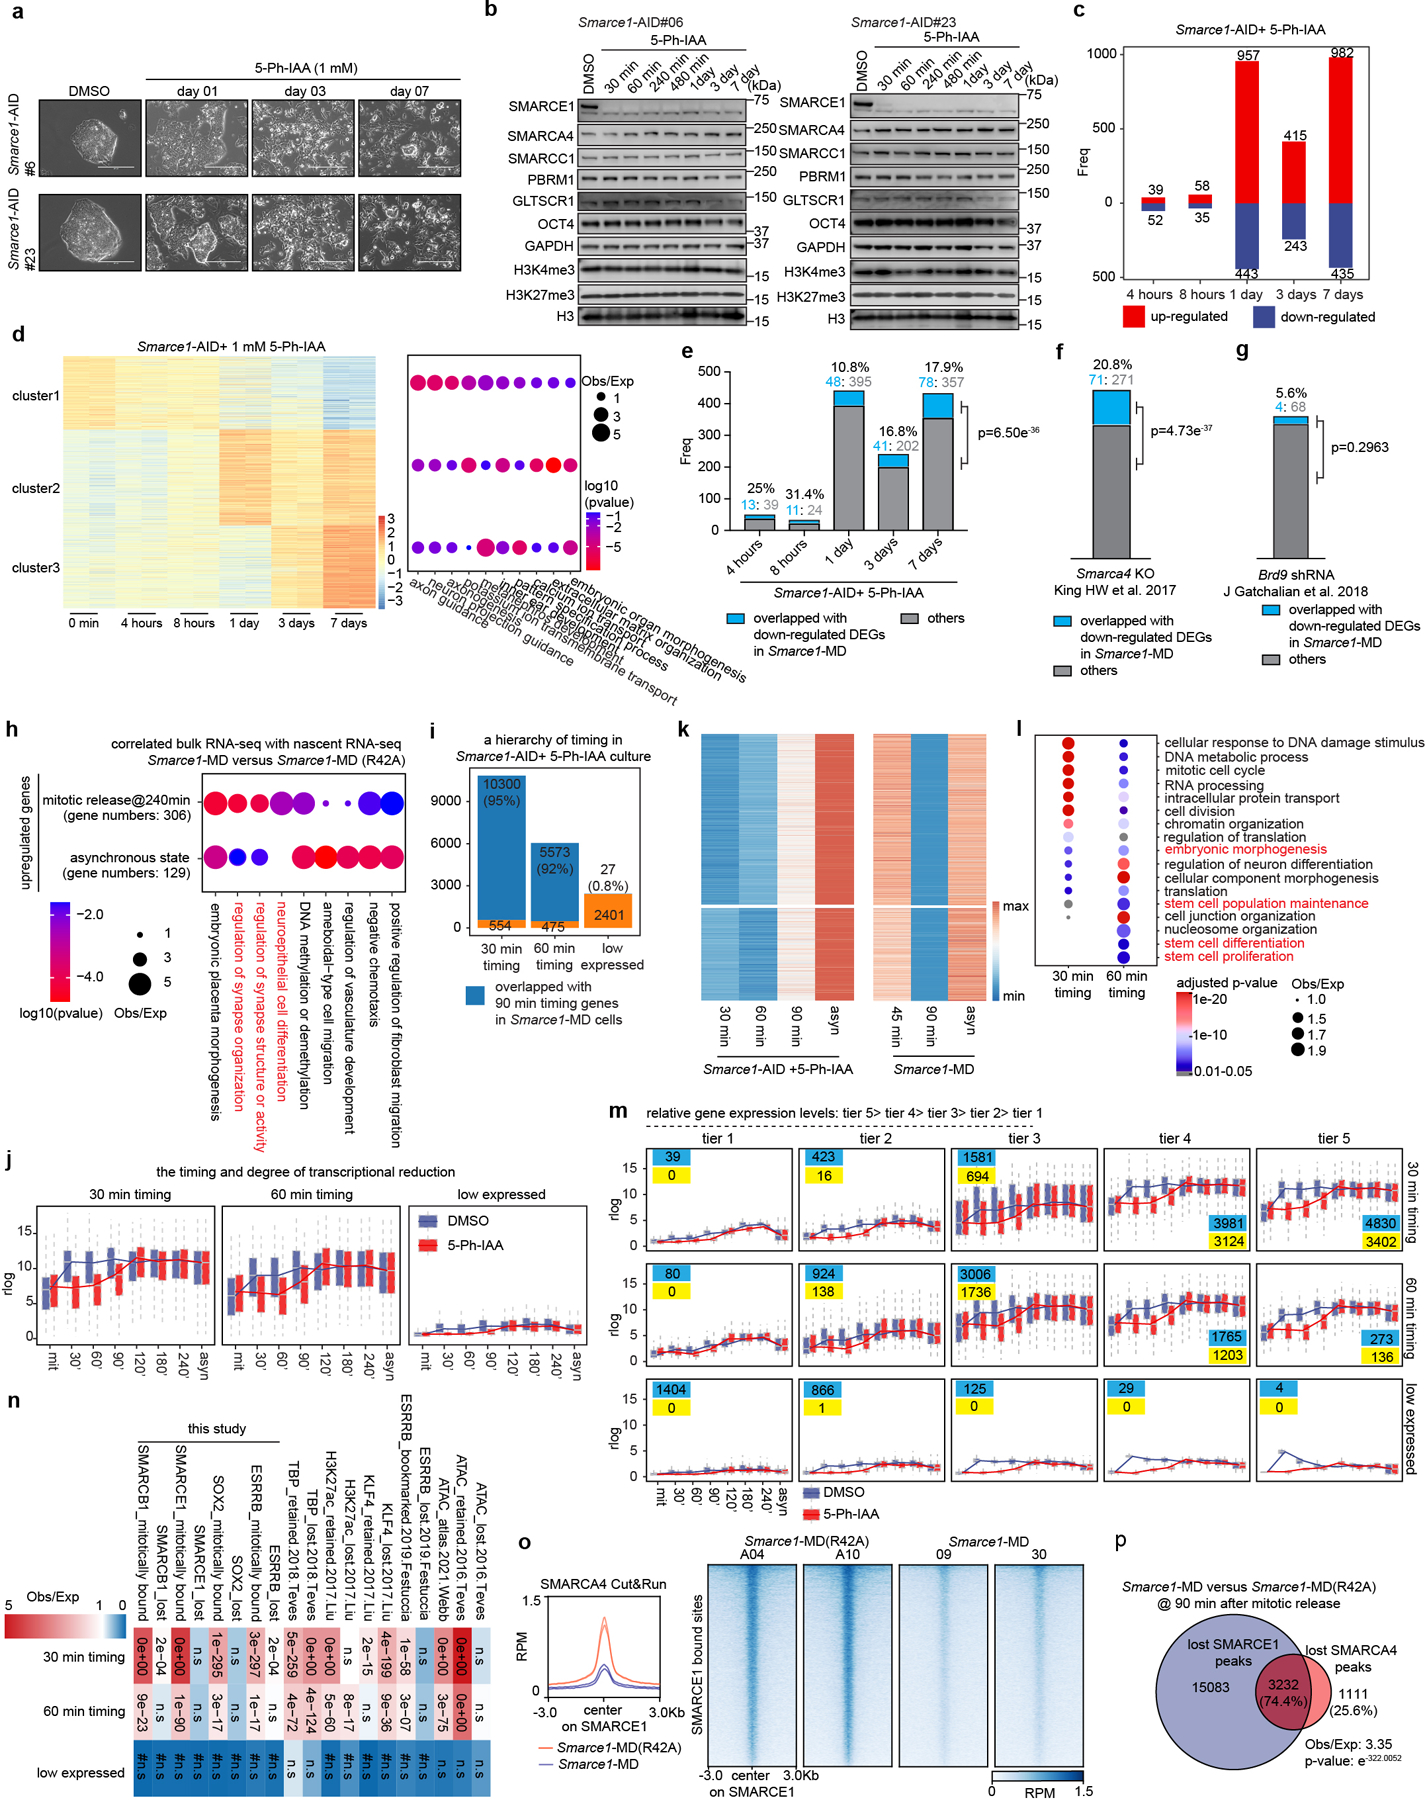
Extended Data Figure 8.

The timing and degree of nascent transcription changes in mitotic SMARCE1 depleted mouse ES cells. a, Cell morphologies of DMSO treated Smarce1-AID cells (clones #6 and #23) and the cells treated with 1 μM 5-Ph-IAA for the indicated days. b, Representative immunoblot of Smarce1-AID cells (clones #6 and #23) treated with DMSO or 1 μM 5-Ph-IAA. c, Bar plot showing the numbers of differentially expressed genes (DEGs) identified from Smarce1-AID cells (clones #6 and #23) treated with 1 μM 5-Ph-IAA for the indicated time. d, (left) Heatmap showing DEGs identified from Smarce1-AID cells (clones #6 and #23) treated with 1 μM 5-Ph-IAA for the indicated time. The DEGs were classified into three clusters by k-means clustering. Color bar indicates scaled z score of gene expression. (right) GO analysis indicating pathways enriched for the three clusters. Size of the circle represents ratio of observed (Obs) versus expected (Exp) frequency, and p-value was calculated by two- sided Fisher’s exact test. e, Bar plot showing the contributing number of genes identified from down-regulated DEGs (bulk RNA-seq) in asynchronous Smarce1-MD cells (in which SMARCE1 is solely missing in mitotic cells) to the down-regulated genes identified from Smarce1-AID cells treated with 5-Ph-IAA (in which SMARCE1 is missing throughout the cell cycle). f, Bar plot showing the contributing number of genes identified from down-regulated DEGs (bulk RNA-seq) in asynchronous Smarce1-MD cells to the down-regulated genes identified from Smarca4 knockout (KO) mouse ES cells (King HW et al., 2017). g, Bar plot showing the contributing number of genes identified from down-regulated DEGs (bulk RNA-seq) in asynchronous Smarce1-MD cells to the down-regulated genes identified from Brd9 shRNA transfected mouse ES cells (J Gatchalian et al., 2018). h, GO analysis of relative enrichment or depletion of upregulated genes identified from bulk RNA-seq in the scenario of nascent RNA-seq at 240 min after mitotic release and in asynchronous MD cells. Size of circles indicates ratio of observed (Obs) versus expected (Exp) frequency, and color presents p-value calculated by two-sided Fisher’s exact test. i, The downregulated genes that reached the lowest expression levels in 5-Ph-IAA treated Smarce1-AID mouse ES cells at the indicated time point were defined as “30 min timing” and “60 min timing” genes, respectively; “low expressed” refers to the genes that were consistently lowly expressed (rlog< 4) at all the time points. Genes within the “30 min timing” and “60 min timing” groups from the nascent RNA-seq of 5-Ph-IAA treated Smarce1-AID cells that overlapped with the genes in “90 min timing” group from the nascent transcripts of Smarce1-MD at 90 min are shown in blue. Gene numbers are shown within the bar plot. j, Box plot showing the nascent transcript levels of “30 min timing”, “60 min timing”, and “low expressed” genes at all time points examined in Smarce1-AID cells treated with DMSO or 5-Ph-IAA. k, Heatmap of the DEGs identified from nascent RNA-seq in both the AID system (left) and the MD system (right). Color bar indicates z scaled rlog value. l, GO analysis of “30 min timing” and “60 min timing” genes. Size of the circle represents ratio of observed (Obs) versus expected (Exp) frequency, and p-value was calculated by two- sided Fisher’s exact test. m, Box plot of “30 min timing”, “60 min timing”, and “low expressed” genes separated into 5 tiers based upon nascent gene expression levels. Box plots depict the median transcriptional activity across the time course; in each cluster, the total number of genes is listed in blue and the number of genes that differ significantly between 5-Ph-IAA and DMSO conditions is listed in yellow. n, Relative enrichment or depletion of the lost, retained, bookmarked, and mitotically bound peaks for chromatin accessibility and the indicated factors at “30 min timing”, “60 min timing”, and “low expressed” genes (y-axis). Color indicates ratio of observed (Obs) versus expected (Exp) frequency, and p-value (two-sided Fisher’s extract test) is indicated. Comparisons using <100 overlapping peaks are denoted with a hash mark (#). o, (left) Average binding profiles of SMARCA4 Cut&Run signal on SMARCE1 binding sites in Smarce1- MD(R42A) and Smarce1-MD mouse ES cells at 90 min after mitotic release. (right) Heat maps of SMARCA4 Cut&Run at SMARCE1 binding sites in Smarce1- MD(R42A) and Smarce1-MD mouse ES cells at 90 min after mitotic release. p, Venn diagram showing the overlap between lost SMARCE1 peaks and lost SMARCA4 peaks identified from Smarce1-MD versus Smarce1-MD(R42A) cells at 90 min after mitotic release. Data are compiled from two biological replicates for each clone (Smarce1-AID#06, #23) (c, d, e, f, g, i, j, m). Center lines denote medians; box limits 25th- 75th percentile; whiskers 5th- 95th percentile (j, m). Statistical analysis was performed using two-sided Fisher exact test (e, f, g). The ratio of observed (Obs) versus expected (Exp) frequency is shown, and p-value determined by two-sided Fisher’s exact test is indicated (p).
