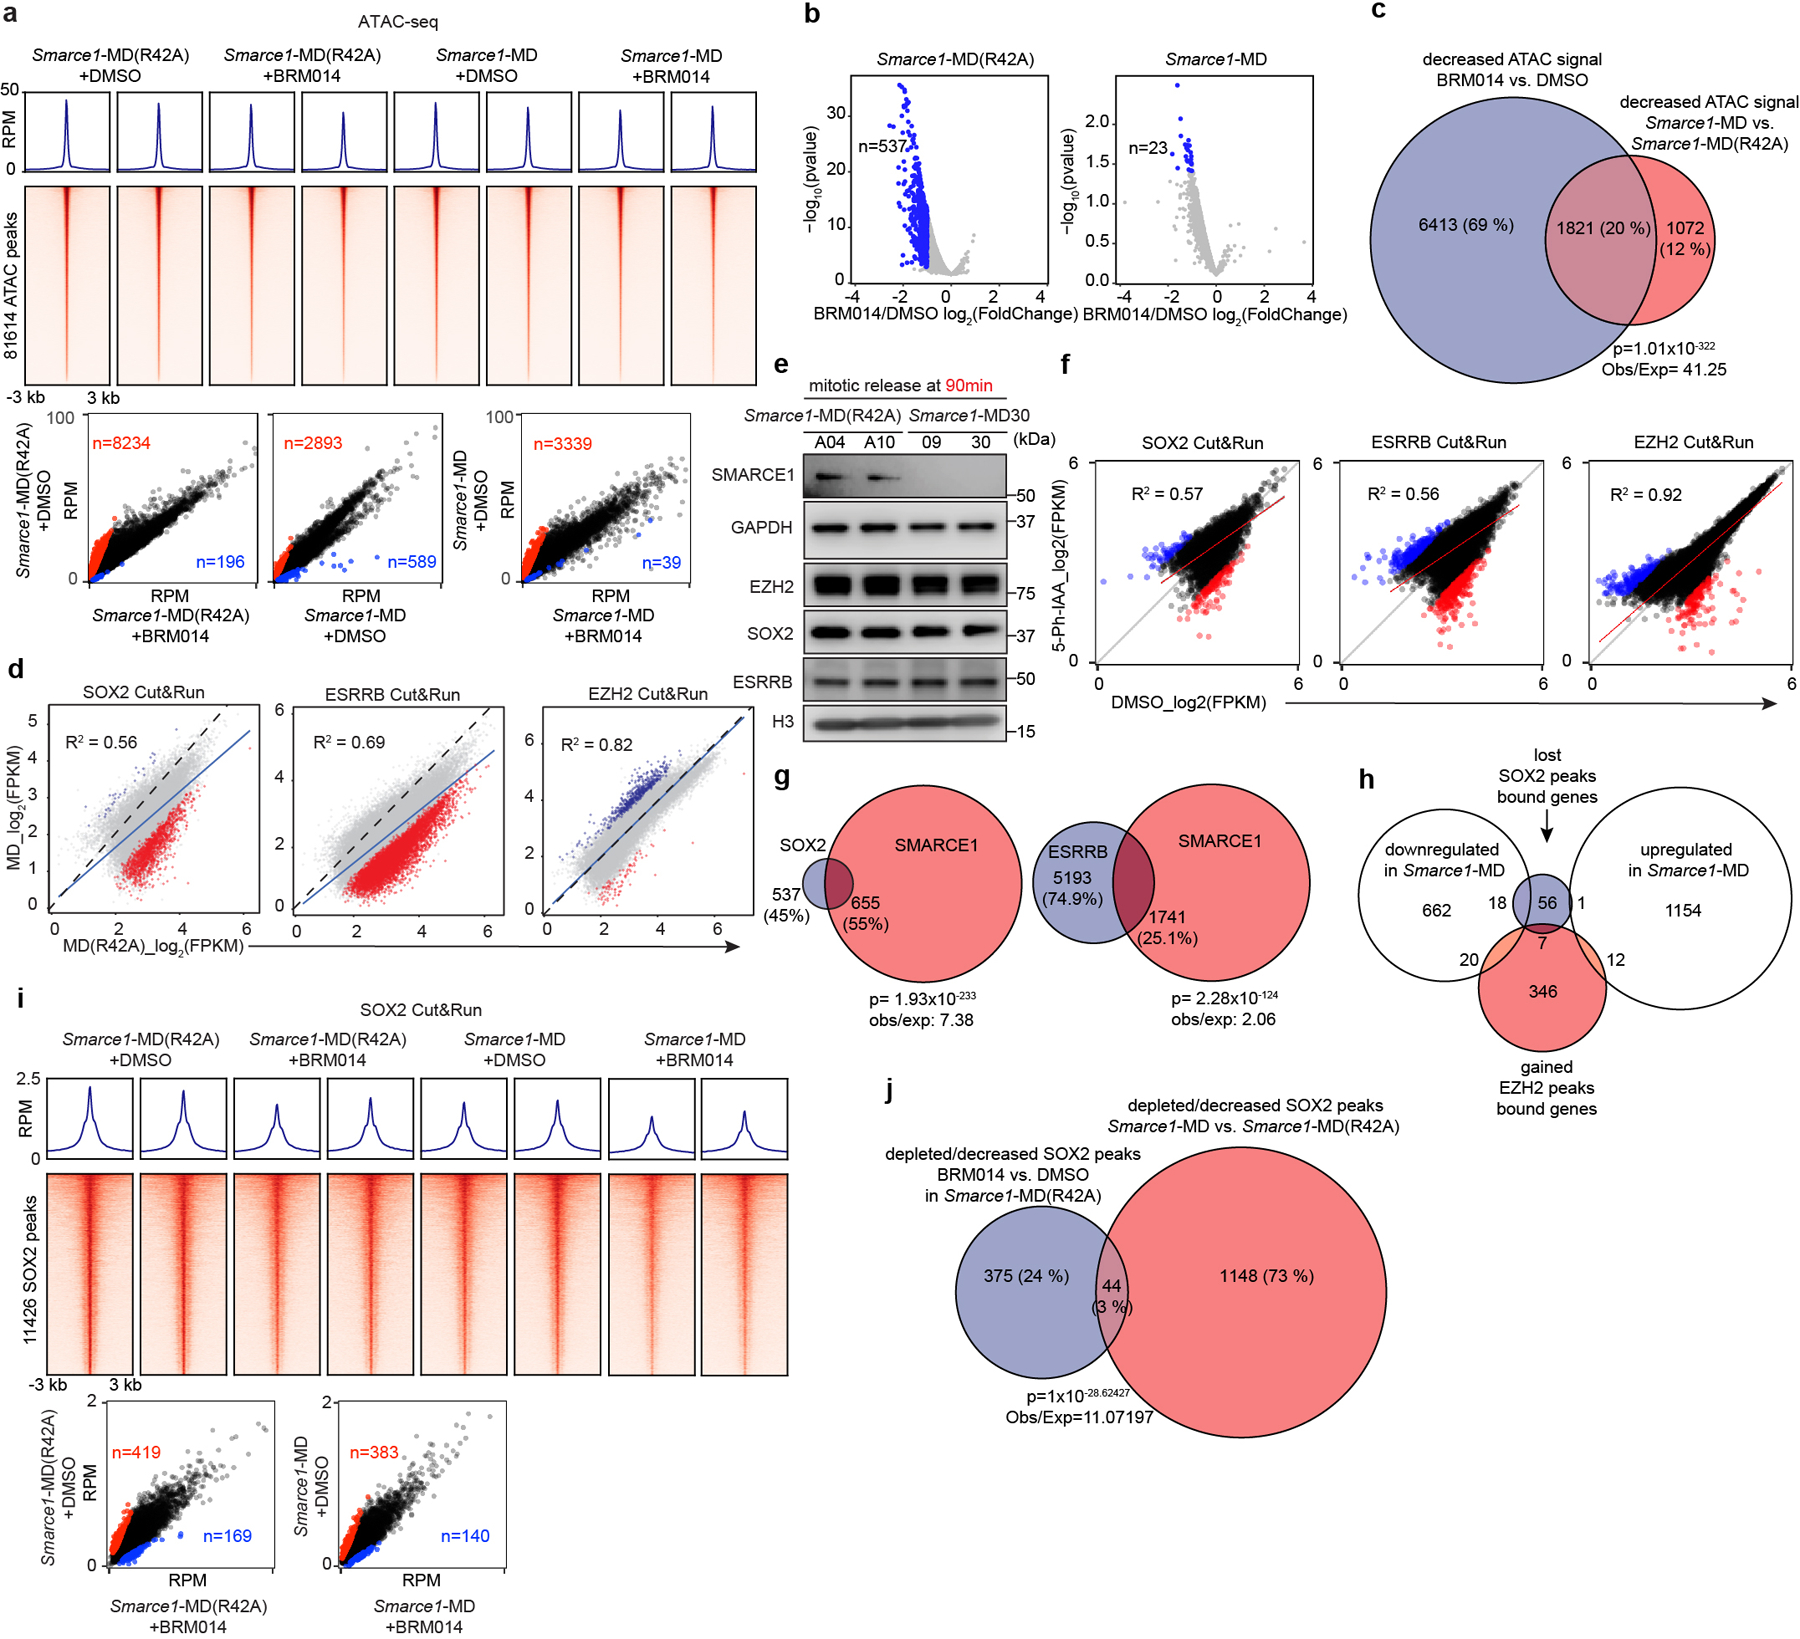
Extended Data Figure 9. Subsequent Activation of Genes Bookmarked by SMARCE1 is ATPase Dependent.

a, (top) Average binding profile of ATAC-seq signal identified in Smarce1-MD (R42A) and Smarce1-MD cells at 90 min following release from mitotic arrest. Cells were treated with either DMSO or 1 μM BRM014 (SMARCA4 ATPase inhibitor). (middle) Heat maps of ATAC-seq signal. (bottom) Scatter plots of ATAC-seq signal in reads per million in the indicated samples. Dots indicate significant loss (red) or gain (blue) of ATAC-signal. b, Volcano plots showing genes with the significantly decreased nascent RNA transcriptional levels under the treatment of BRM014 versus DMSO in Smarce1-MD(R42A) (left) and Smarce1-MD (right) cells at 90 min after releasing from mitotic arrest. P-value in differentially expressed genes test was calculated using Wald test from DESeq2. c, Venn diagram showing the overlap of decreased ATAC-seq sites affected by ATPase inhibitor BRM014 to those affected by the loss of SMARCE1 in mitosis. d, Scatter plots of SOX2 (left), ESRRB (middle), and EZH2 (right) peak changes between Smarce1-MD (R42A) and Smarce1-MD cells at 90 min after mitotic release. Dots indicate significant binding loss (red) or gain (blue) following mitotic loss of SMARCE1. e, Representative immunoblot of Smarce1- MD (R42A) clones A04 and A10 and Smarce1- MD clones 09 and 30 at 90 min after mitotic release. f, Scatter plots of SOX2 (left), ESRRB (middle), and EZH2 (right) peak changes in mitotic Smarce1-AID mouse ES cells (clones 06 and 23) treated with DMSO or 5-Ph-IAA for 1 hour. Dots indicate significant binding loss (red) or gain (blue) following mitotic loss of SMARCE1. g, Venn diagram showing the overlap between decreased/depleted SOX2 (left)/ESRRB (right) peaks and retained SMARCE1 peaks identified from Smarce1-MD versus Smarce1-MD (R42A) cells at 90 min after mitotic release. h, Overlap of genes with lost/decreased SOX2 peaks or gained EZH2 peaks and genes upregulated or downregulated in Smarce1-MD mouse ES cells. i, (top) Average binding profile of SOX2 Cut&Run signal identified in Smarce1-MD (R42A) and Smarce1- MD cells at 90 min following release from mitotic arrest. Cells were treated with either DMSO or 1 μM BRM014. (middle) Heat maps of SOX2 signal. (bottom) Scatter plots of SOX2 signal in reads per million in the indicated samples. Dots indicate significant loss (red) or gain (blue) of SOX2 signal. j, Venn diagram showing the overlap of depleted/decreased SOX2 peaks identified from Smarce1-MD (R42A) cells treated with BRM014 versus DMSO and Smarce1-MD versus Smarce1-MD (R42A) cells at 90 min after mitotic release. All data are compiled from two replicates. Correction values were obtained from Pearson’s product moment correlation (d, f). The ratio of observed (Obs) versus expected (Exp) frequency is shown, and p-value determined by two-sided Fisher’s exact test is indicated (c, g, j).
