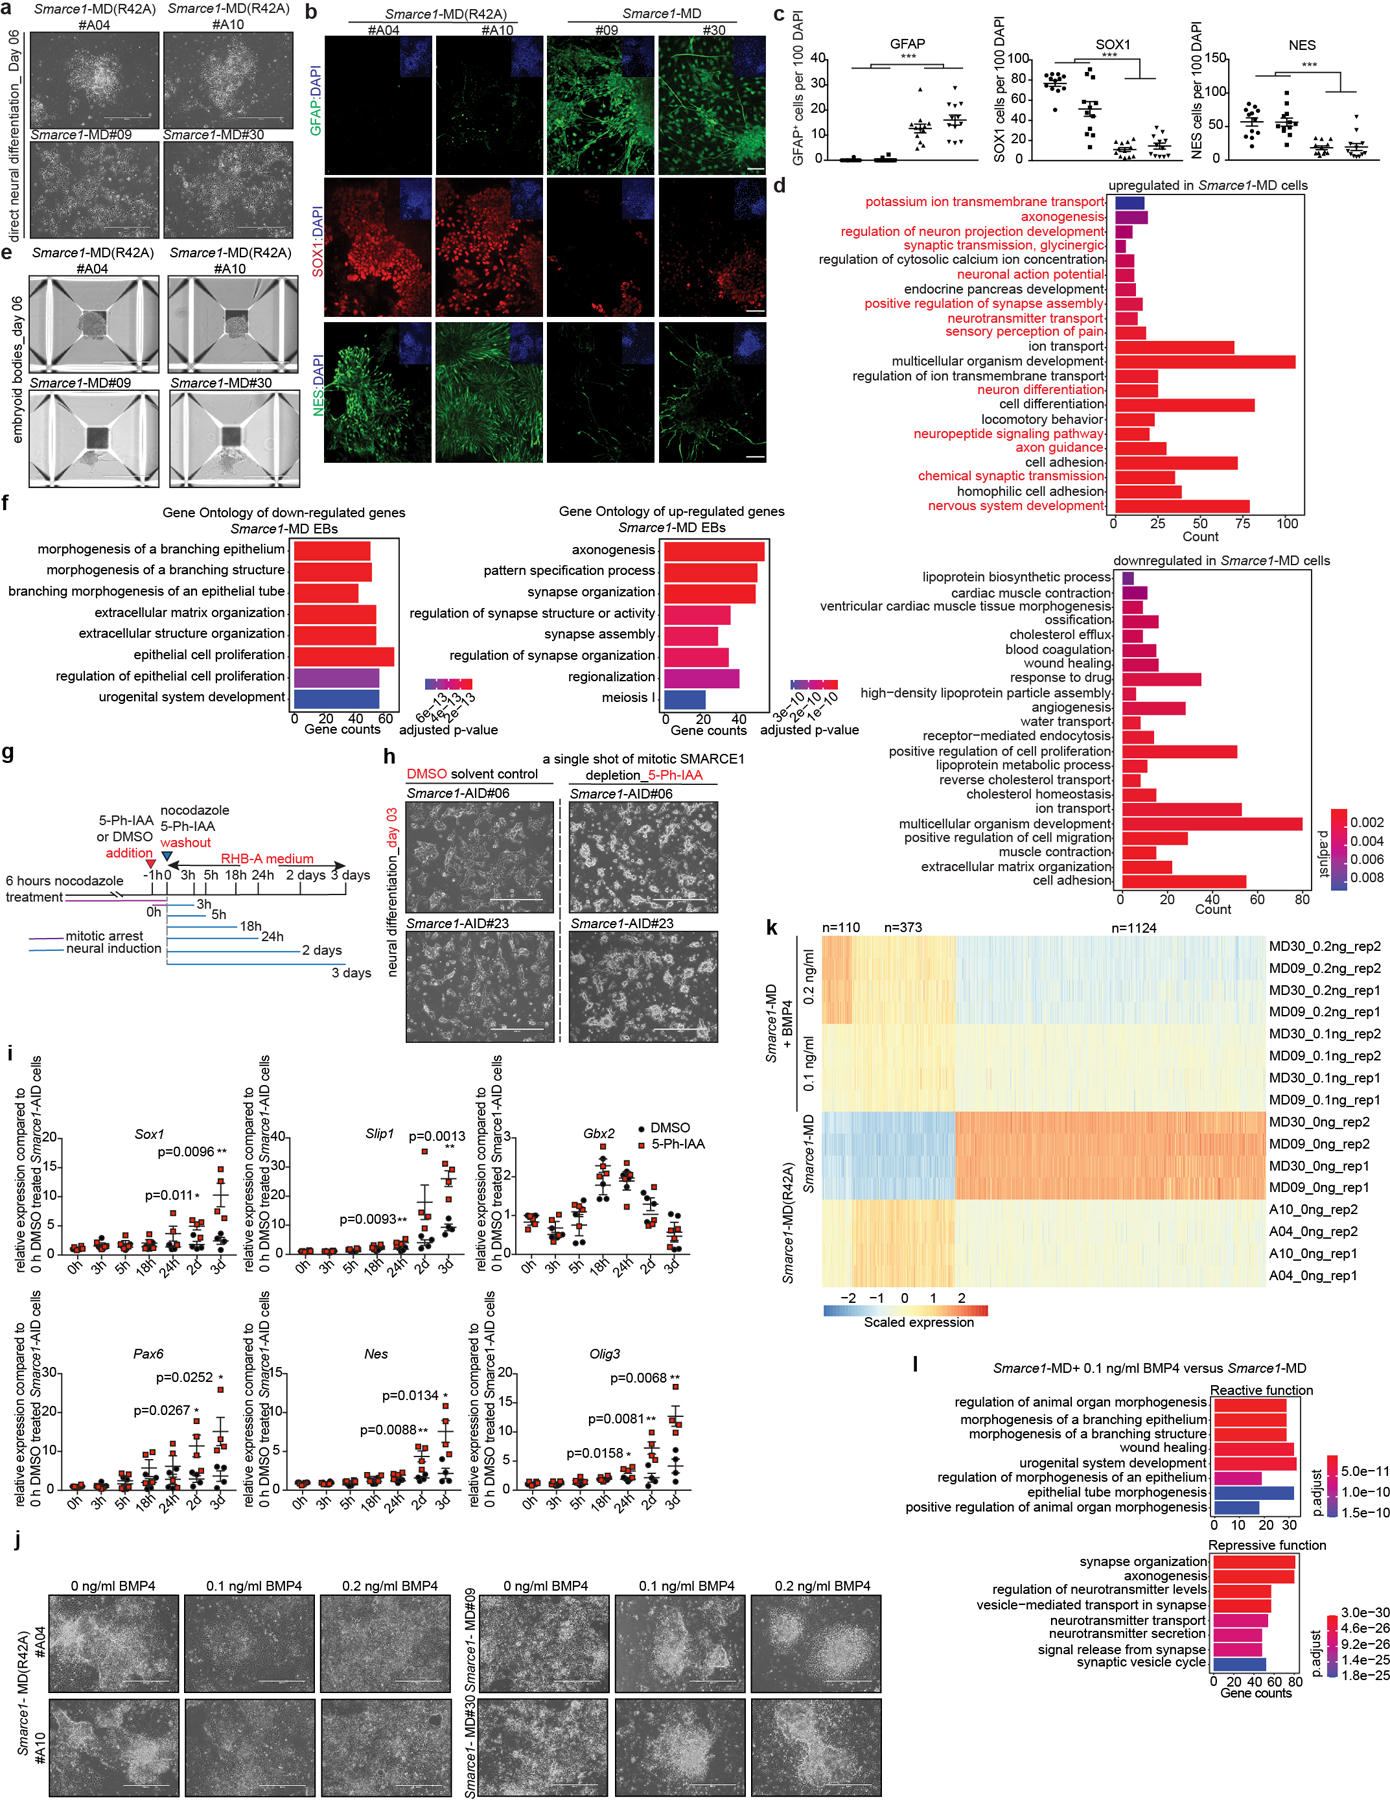
Extended Data Figure 10. Mitotic SMARCE1 is required for the appropriate neural differentiation.

a, Bright field images presenting cell morphologies of Smarce1-MD(R42A) and Smarce1-MD derived neural cells at day six after induction. b, c, (b) IHC staining of DAPI and GFAP (top), SOX1 (middle), and NES (bottom) in Smarce1-MD (R42A) and Smarce1-MD derived neural cells at day six after induction. (c) Statistical analysis of (b) (p value for GFAP= 2.72e−10, p value for SOX1= 3.01e−11, p value for NES= 4.62e−9). d, GO analysis of differentially expressed genes between Smarce1- MD (R42A) and Smarce1- MD cultures at day six after neural induction. Over-representation test was used to calculated GO term enrichment with FDR for multiple test correction. e, Representative morphologies of embryoid bodies derived from Smarce1- MD(R42A) and Smarce1- MD mouse ES cells at day six. f, GO analysis of differentially expressed genes identified in (e). Over-representation test was used to calculated GO term enrichment with FDR for multiple test correction. g, Schematic for direct neural induction and 5-Ph-IAA treatment during mitosis and mitotic release in the AID degron system. h, Bright field images presenting cell morphologies of DMSO or 5-Ph-AA treated mitotic Smarce1-AID derived cultures at day three after induction. i, Quantitative PCR (qPCR) for neuroectoderm markers in DMSO or 5-Ph-AA treated mitotic Smarce1-AID (clones #6 and #23). j, Representative morphologies of Smarce1- MD(R42A) and Smarce1- MD cultures supplemented with indicated dose of BMP4 at day six after neural induction. k, Heat map showing the differentially expressed genes in (j). l. GO analysis of (k). Over-representation test was used to calculated GO term enrichment with FDR for multiple test correction. All data are representative and compiled from two independent experiments. N= 2 biological replicates for each clone (Smarce1-AID#06, #23) (i). Data are shown as mean± s.e.m., n= 12 images/sample collected from 2 biologically independent experiments (c). Scale bars: 400 μm (a, b, e, j), 1000 μm (h). P-value was calculated using two-tailed unpaired Student’s t- Test (* p<0.05, ** p<0.01, *** p< 0.001) (c, i).
