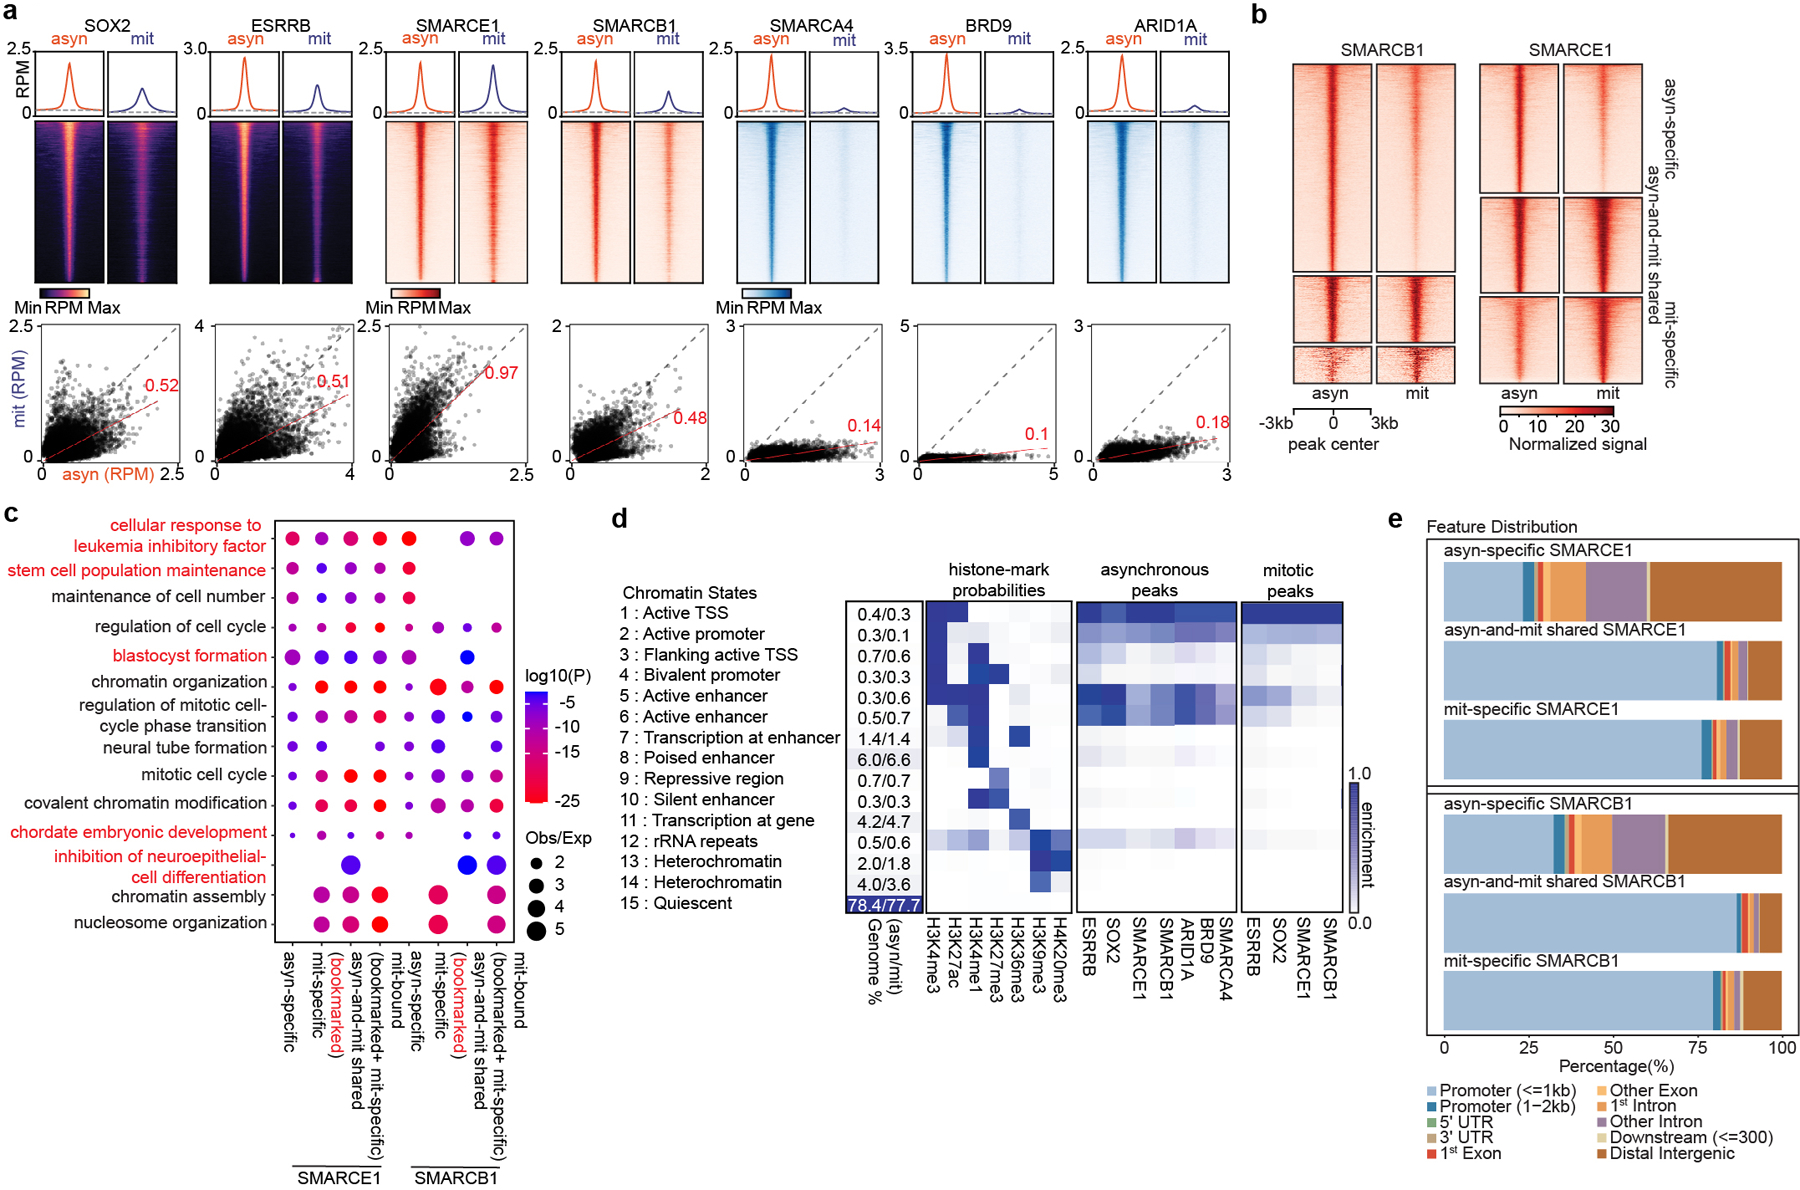
Fig 2. SWI/SNF subunits preferentially bind at promoters in mitosis.

a, (top) Average binding profile of Cut&Run signal at the indicated binding regions (± 3000-bp peak summit) identified in asynchronous (asyn) and mitotic (mit) mouse ES cells. Average binding profiles represent reads per million (RPM); the y-axis is scaled by median asynchronous binding. (bottom) Scatter plots of Cut&Run signal in reads per million at the designated regions (± 250-bp peak summit) in asynchronous and mitotic mouse ES cells. Linear regression of RPM value for asynchronous cells divided by the value for mitotic cells were estimated and regression slopes are shown in red. Grey dashed lines indicate the random background. b, Heatmap of SMARCB1 and SMARCE1 peaks in asynchronous and mitotic mouse ES cells (four replicates were pooled together). c, GO analysis of genes bound by asynchronous-specific, mitosis-specific, asynchronous+ mitosis shared (bookmarked), and mitosis bound at any time (bookmarked+ mitosis-specific) SMARCE1 and SMARCB1 peaks using GREAT in asynchronous and mitotic mouse ES cells. Size of the circle represents ratio of observed (Obs) versus expected (Exp) frequency, and p-value was calculated by two- sided Fisher’s exact test. d, Fifteen chromatin states were defined by ChromHMM using seven histone marks. Genome coverage, histone-mark possibilities and the feature distributions of SWI/SNF subunits, ESRRB and SOX2 on chromatin are shown for each chromatin state in both asynchronous and mitotic mouse ES cells. e, Genomic distribution of asyn- specific, asyn- and mit- shared, and mit- specific peaks of SMARCE1 and SMARCB1. Data are compiled from four (Cut&Run for SMARCE1 and SMARCB1) and two (Cut&Run for SOX2, ESRRB, SMARCA4, BRD9, and ARID1A) replicates respectively.
