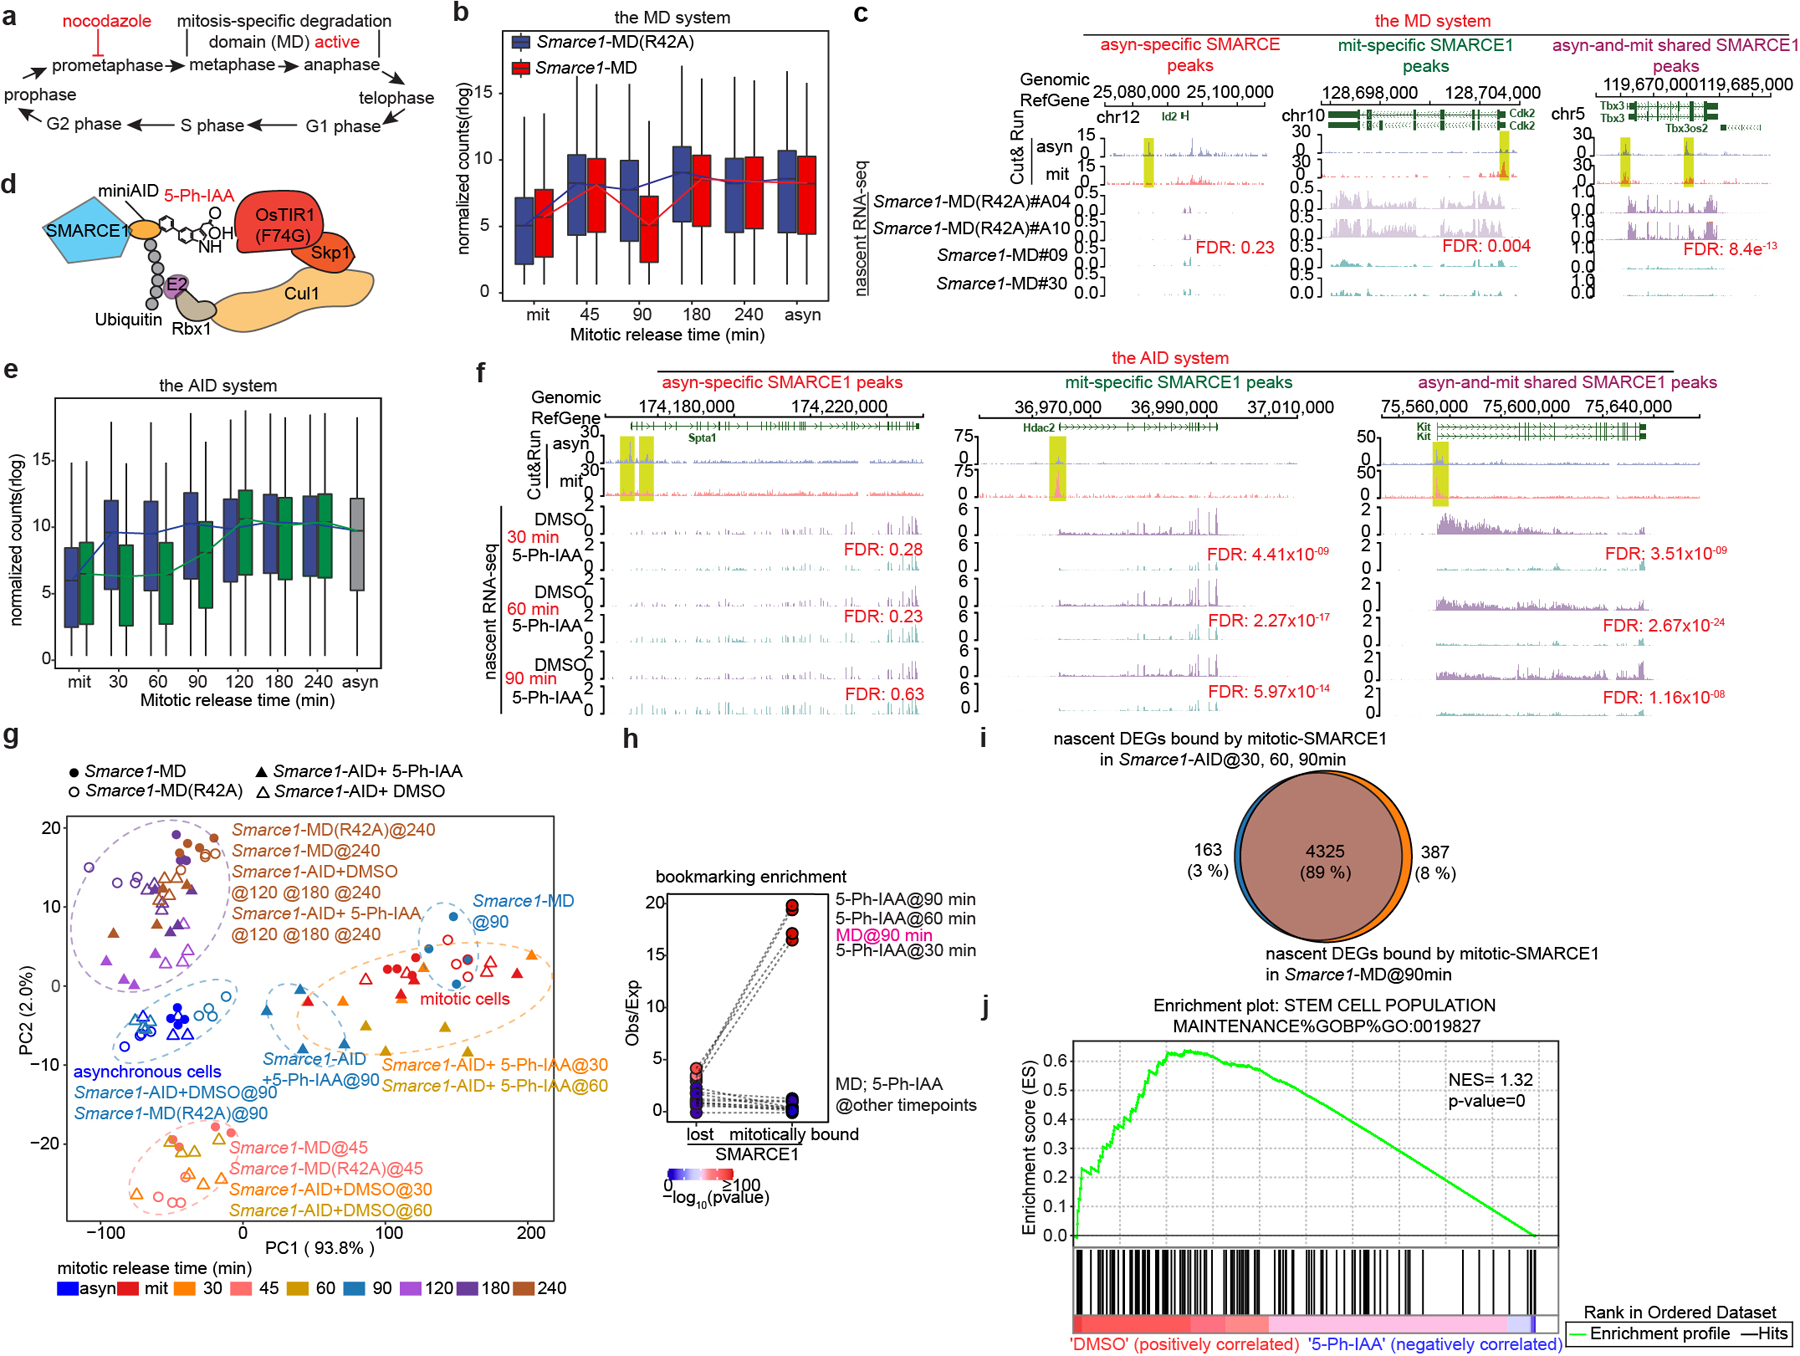
Fig 3. SMARCE1 reactivates bookmarked genes.

a, Schematic showing MD degron activity. b, Expression levels of genes bound by SMARCE1 in mitosis from Smarce1-MD (R42A) (clone A04 and A10) and Smarce1-MD (clone 09 and 30) in asynchronous, mitotic and released cells over time. c, Representative SMARCE1 peaks and nascent RNA profiles in Smarce1- MD (R42A) and Smarce1- MD cells 90 min after mitotic release. d, Diagram of auxin-inducible degron model. e, Expression levels of genes bound by SMARCE1 in mitosis from DMSO and 5-Ph-IAA treated Smarce1-AID (clones 6 and 23) cells in asynchronous, mitotic and mitotic-released cells. f, Representative SMARCE1 peaks and nascent RNA in DMSO and 5-Ph-IAA treated Smarce1-AID (clones 6 and 23) cells at 30 min, 60 min and 90 min after mitotic release. g, PCA of nascent transcripts from Smarce1-MD (R42A), Smarce1-MD, DMSO and 5-Ph-IAA treated Smarce1-AID cells at each time point. Colors indicate time; shapes show different cell lines and treatments. h, Enrichment of mitotically bound and mitotically lost SMARCE1 Cut&Run peaks at promoters of downregulated genes in the MD and AID systems by nascent RNA-seq. Each point represents observed/excepted frequency of DEGs to be associated with mitotically lost SMARCE1 binding (left) or with mitotically bound SMARCE1 (right). Color indicates p values. i, Overlap between genes bound by mitotic SMARCE1 and differentially expressed (DEGs) in the AID and MD systems. j, GSEA illustrating the enrichment score (ES) for the selected set (stem cell population maintenance GO: 0019827) of downregulated genes in Smarce1-AID treated with 5-Ph-IAA for 30 minutes (blue) compared to the DMSO control (red) (nominal P= 0, nonparametric permutation test). NES, normalized enrichment score. N=2 biological replicates for each clone (b, c, e, f, g, h, i, j). Center lines denote medians; box limits 25th- 75th percentile; whiskers 5th- 95th percentile (b, e).
