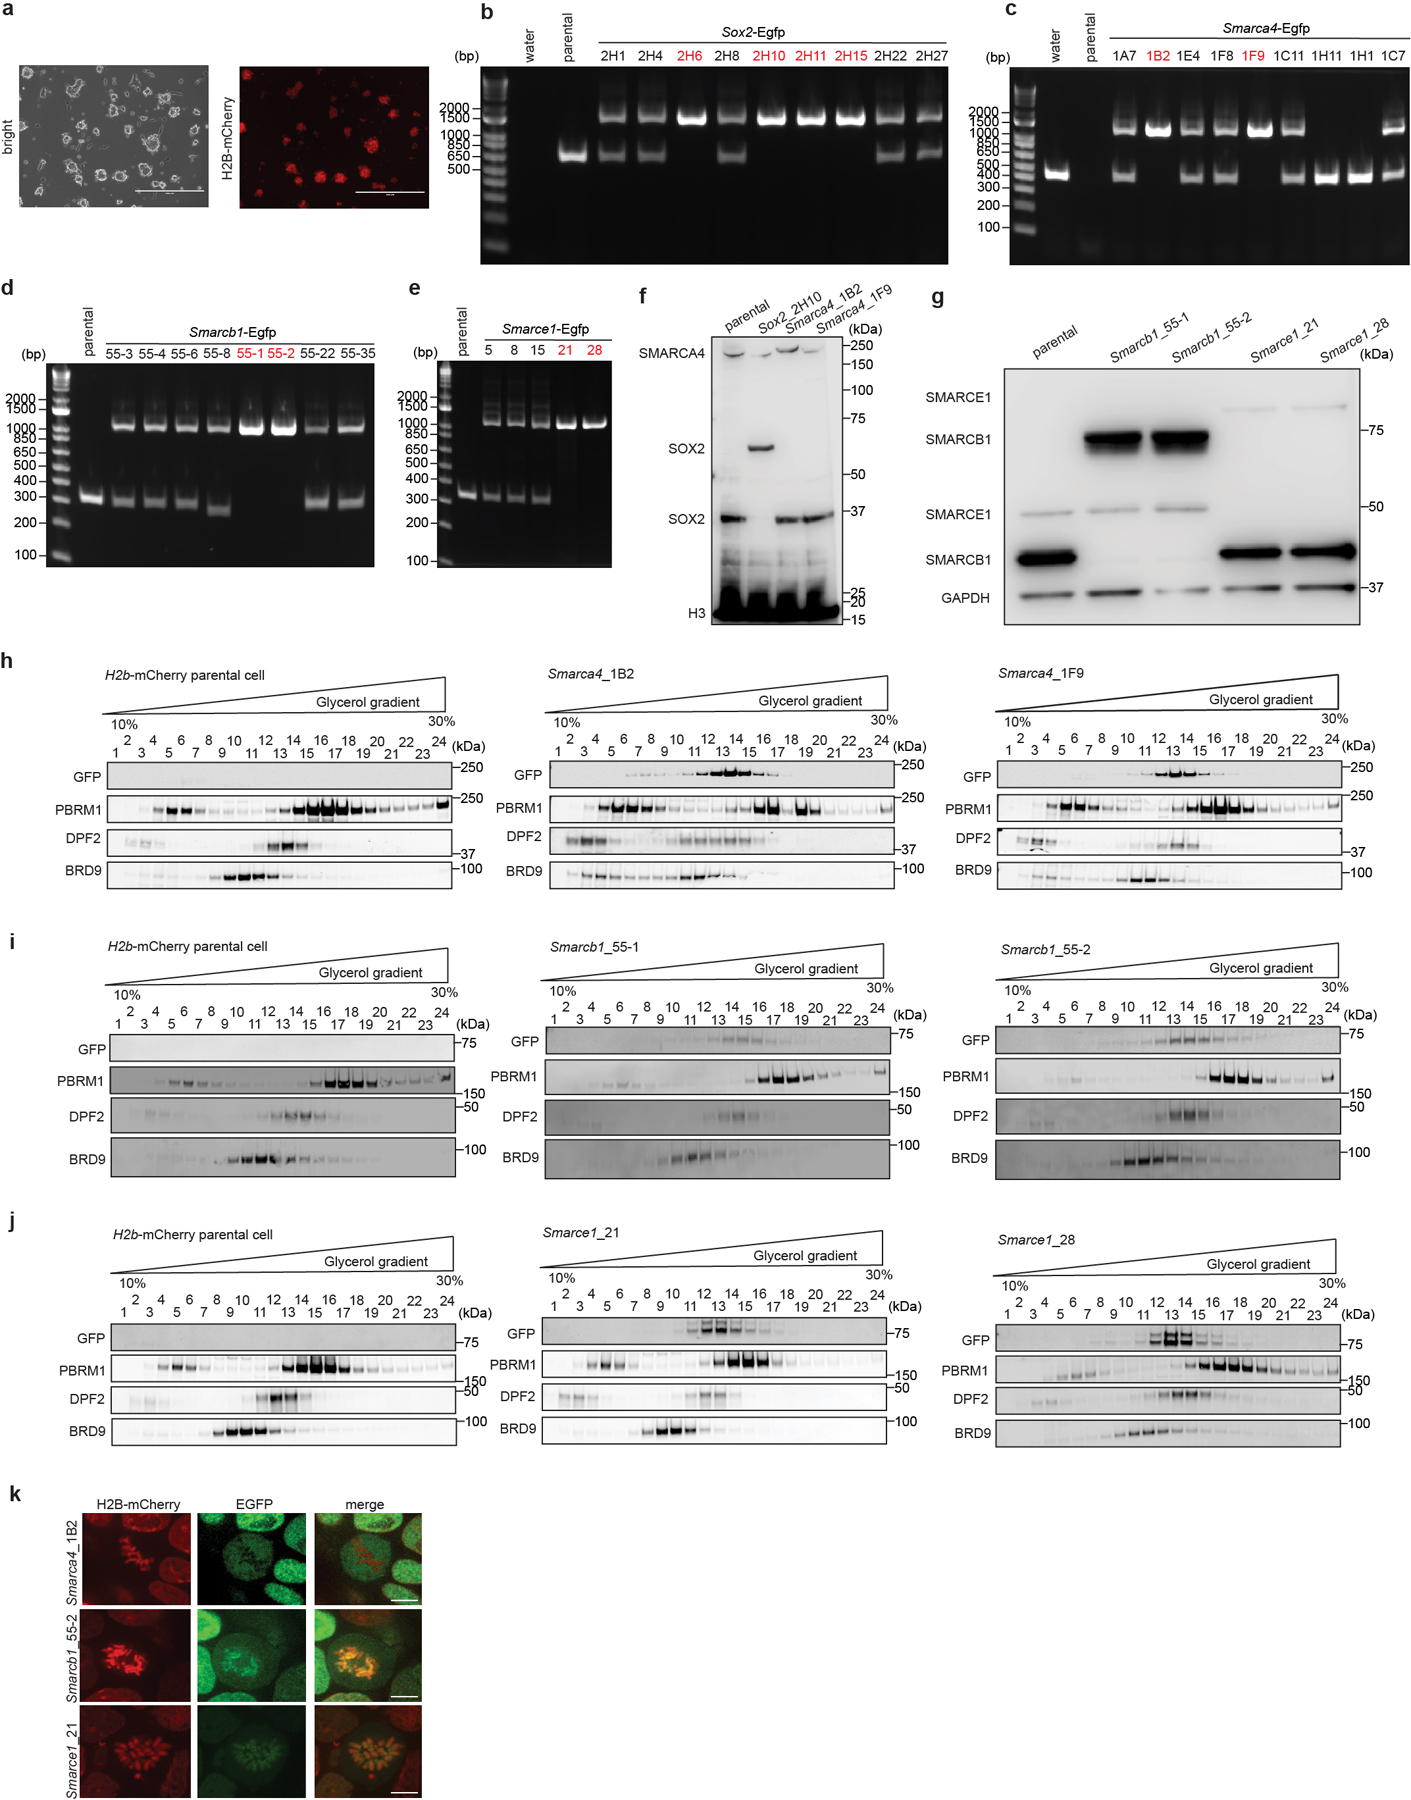
Extended Data Figure 2. Generation and live-cell imaging of endogenous C-terminal EGFP-tagged SOX2, SMARCA4, SMARCB1, and SMARCE1 mouse ES cells.

a, Images showing mouse ES cells stably expressing H2B-mCherry. b, c, d, e, PCR-based genotyping assay validating the generation of the Sox2-Egfp (b), Smarca4-Egfp (c), Smarcb1-Egfp (d), and Smarce1-Egfp (e) homozygous knock-in mouse ES cells. f, g, Western blot validating SOX2-EGFP and SMARCA4-EGFP (f), and SMARCB1-EGFP and SMARCE1-EGFP (g) protein expression, with H3 or GAPDH as loading control. h, i, j, Glycerol gradient and immunoblot performed on H2B-mCherry parental cells and Smarca4-Egfp (h), Smarcb1-Egfp (i), and Smarce1-Egfp (j) clones of mouse ES cells which were used for live-cell imaging. k, Representative live-cell imaging of asynchronous mouse ES cells stably expressing H2B- mCherry with endogenously tagged EGFP at the C-terminal of SMARCA4, SMARCB1, and SMARCE1, respectively. Scale bar: 10 μm. Data are representative of single experiments that assess several independent clones for genotype (b, c, d, e, f, g) and live-cell imaging (k). Data are representative of two independent replicates (h, i, j).
