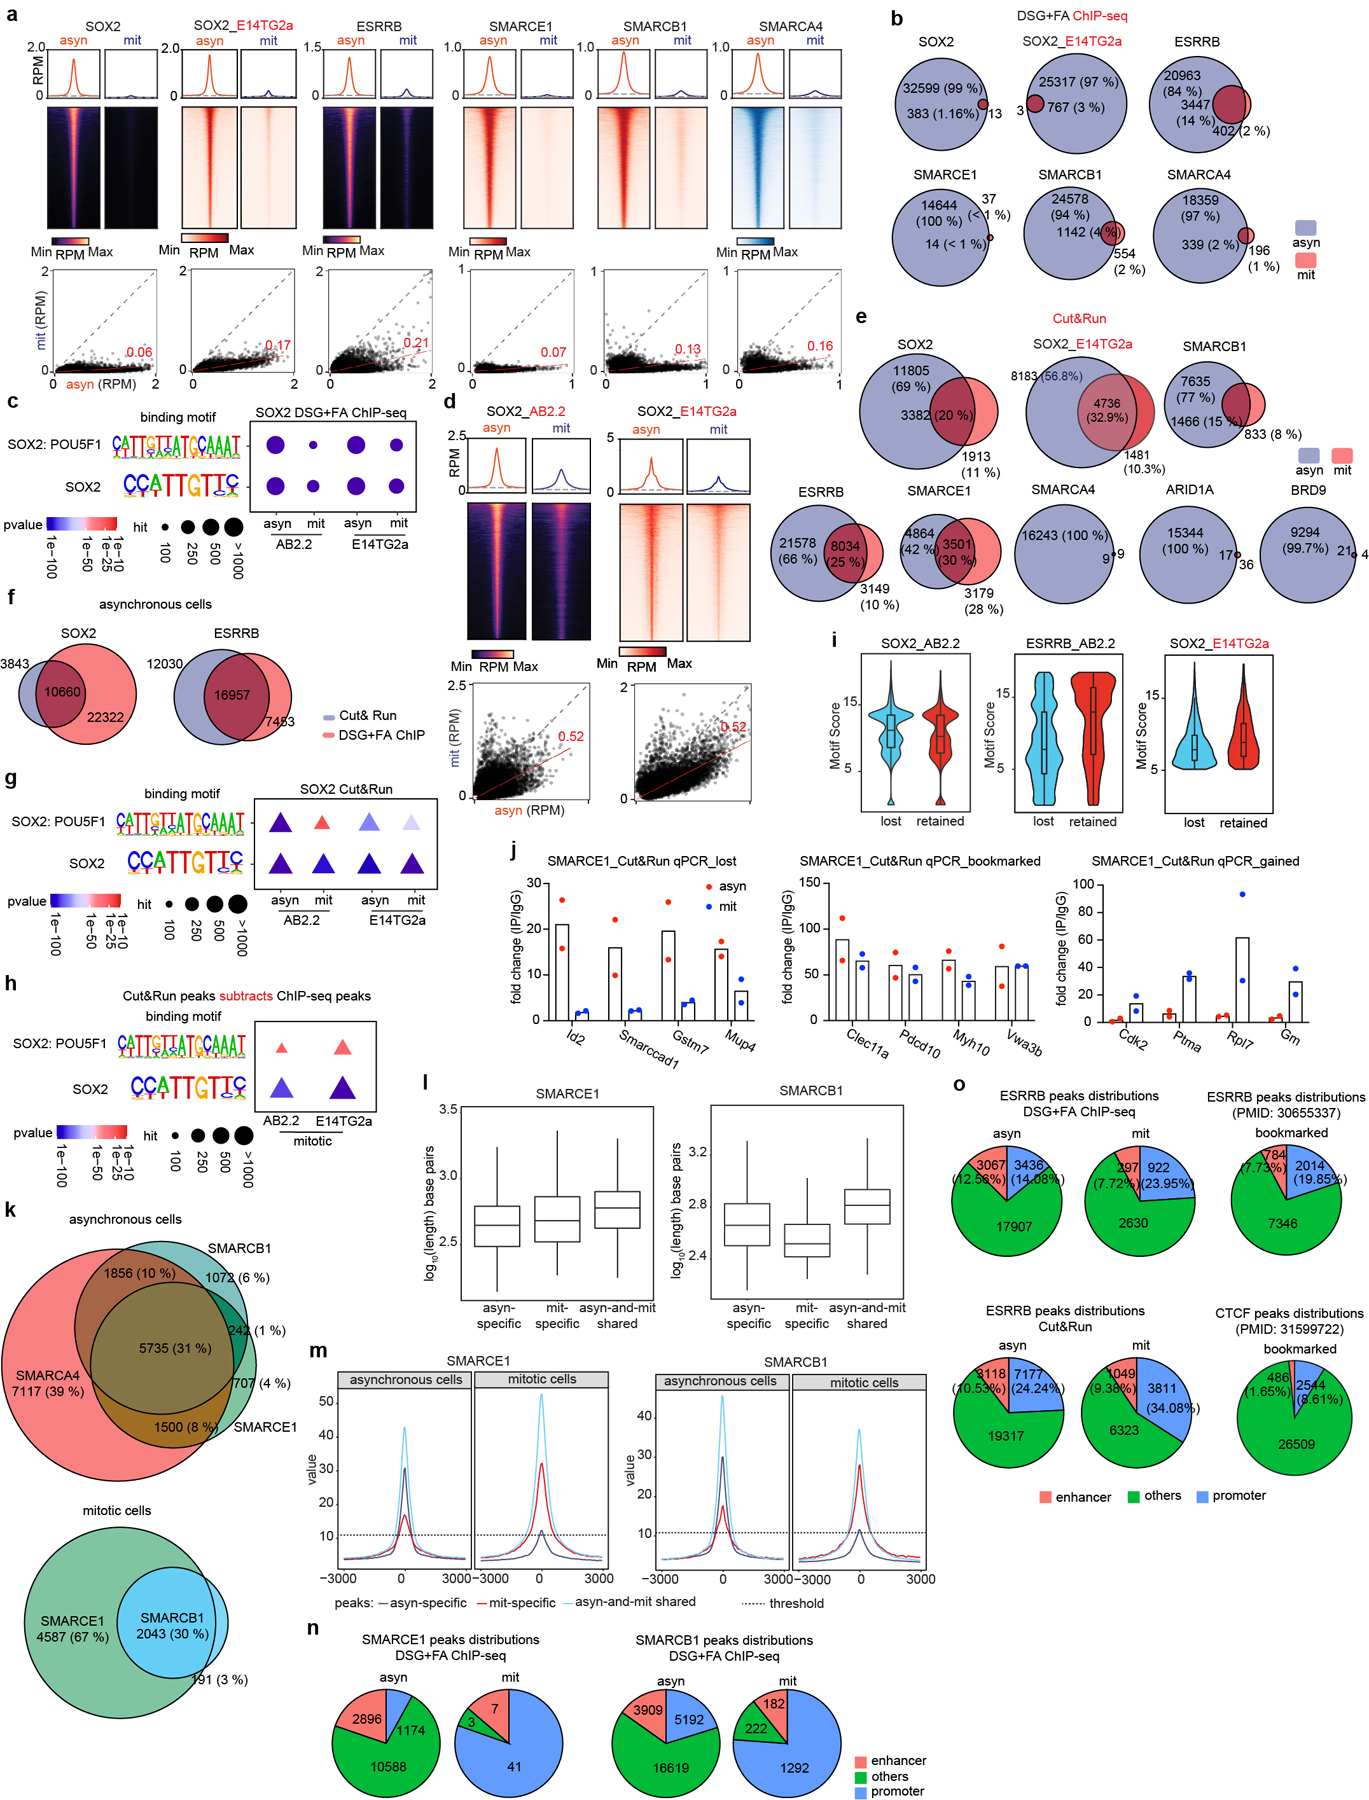
Extended Data Figure 3. Binding of SOX2, ESRRB and SWI/SNF subunits in asynchronous and mitotic cells.

a, (top) Average binding profile of DSG+ FA cross-linked ChIP-seq signal at the indicated binding regions (± 3000-bp peak summit) identified in asynchronous (asyn) and mitotic (mit) AB2.2 and E14TG2a (as indicated) mouse ES cells. (bottom) Scatter plots of DSG+ FA ChIP-seq signal in reads per million at the designated regions (± 250-bp peak summit) for asynchronous and mitotic mouse ES cells. Linear regression of RPM value of asynchronous cells divided by the value for mitotic cells were estimated and regression slopes are shown in red. Grey dashed lines indicate the random background. b, Venn diagrams showing the overlap of DSG+ FA ChIP-seq peaks in asynchronous (blue) and mitotic (red) AB2.2 and E14TG2a mouse ES cells as indicated. c, SOX2: POU5F1 co-binding motifs and SOX2 binding motifs identified from SOX2 DSG+ FA ChIP-seq in asynchronous and mitotic AB2.2 and E14TG2a mouse ES cells as indicated. P-value was calculated by two- sided Fisher’s exact test. d, (top) Average binding profile of Cut&Run signal at SOX2 binding regions (± 3000-bp peak summit) identified in asynchronous and mitotic AB2.2 or E14TG2a cells. (bottom) Scatter plots of Cut&Run signal in reads per million at the designated regions (± 500-bp peak summit) for asynchronous and mitotic mouse ES cells. Linear regression of RPM value of asynchronous cells divided by the value for mitotic cells were estimated and regression slopes are shown in red. Grey dashed lines indicate the random background. e, Venn diagrams showing the overlap of Cut&Run peaks of designated factors in asynchronous (blue) and mitotic (red) in AB2.2 or E14TG2a mouse ES cells as indicated. f, Venn diagram showing the overlaps of SOX2 peaks (left) and ESRRB peaks (right) identified from Cut&Run (blue) and DSG+ FA ChIP-seq (red) in asynchronous mouse ES cells. g, SOX2: POU5F1 co-binding motifs and SOX2 binding motifs identified from SOX2 Cut&Run in asynchronous and mitotic AB2.2 and E14TG2a mouse ES cells as indicated. P-value was calculated by two- sided Fisher’s exact test. h, SOX2: POU5F1 co-binding motifs and SOX2 binding motifs identified from SOX2 Cut&Run peaks subtracting SOX2 DSG+ FA ChIP-seq peaks in mitotic AB2.2 and E14TG2a cells as indicated. P-value was calculated by two- sided Fisher’s exact test. i, Violin plots depicting the FIMO-called best motif score per SOX2 or ESRRB peak in sites losing binding in mitosis (lost) or retaining binding (retained), performed by Cut&Run in the indicated mouse ES cell lines. j, Cut&Run-qPCR validating the lost (asyn-specific), bookmarked (asyn- and mit- shared), and gained (mit-specific) SMARCE1 peaks in asynchronous and mitotic mouse ES cells. k, Venn diagram showing the overlap of SMARCA4, SMARCB1, and SMARCE1 Cut&Run peaks in asynchronous cells (top) and the overlap between SMARCE1 and SMARCB1 Cut&Run peaks in mitotic mouse ES cells (bottom). l, SMARCE1 (left) and SMARCB1 (right) peak length for asyn-specific, mit-specific, and asyn- and mit- shared peaks in asynchronous and mitotic mouse ES cells. m, Average SMARCE1 (left) and SMARCB1 (right) binding profiles at asyn-specific, mit-specific, and asyn- and mit- shared regions. n, To confirm localization of SMARCE1 and SMARCB1 as detected by Cut&Run, ChIP-seq was utilized. The distributions of SMARCE1 (left) and SMARCB1 (right) via ChIP-seq (using DSG+ FA fixation) at promoter and enhancer regions in asynchronous and mitotic mouse ES cells. o, The distributions of ESRRB peaks from DSG+ FA ChIP-seq and Cut&Run in asynchronous and mitotic AB2.2 mouse ES cells. Bookmarked ESRRB and CTCF peaks are as previously reported. All data are compiled from two biological replicates. Statistical analysis was performed using two- sided Fisher’s exact test (c, g, h). Center lines denote medians; box limits 25th- 75th percentile; whiskers 5th- 95th percentile (i, l).
