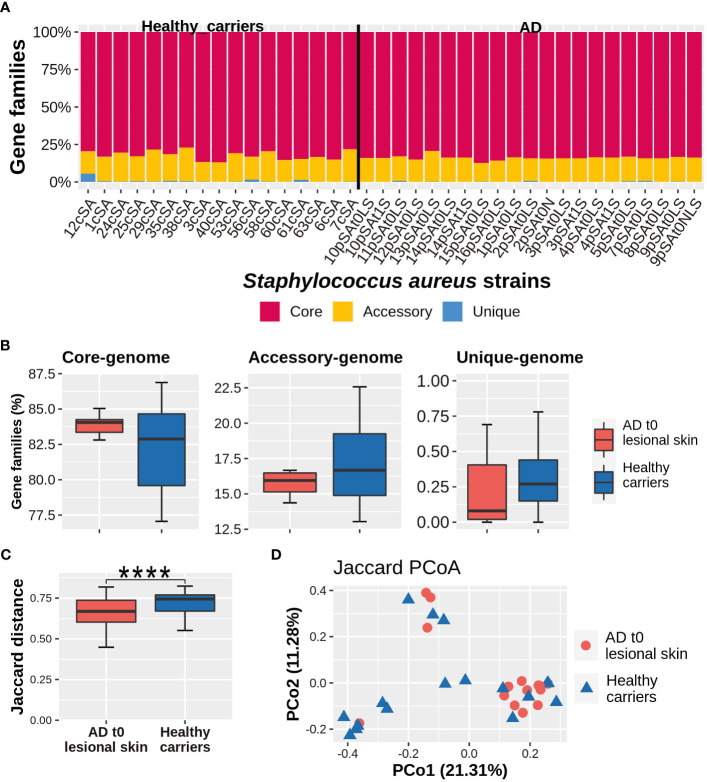
Figure 3.
(A) Genomic composition of each S. aureus strain. (B) Relative abundance of the core, accessory, and unique genes. (C) Within-group diversity, measured by the Jaccard dissimilarity index. Values can range from 0 (i.e. the organisms share the same set of genes) to 1 (i.e. no genes in common). Comparisons between AD lesional strains and healthy carriers-related strains were carried out by Mann-Whitney U-test, considering a p-value ≤ 0.05 as statistically significant. (****p-value ≤ 0.0001). (D) Between-diversity analysis expressed by the Principal coordinate analysis, based on the Jaccard index and performed on AD lesional skin and healthy carriers-related strains. For each Principal coordinate, the variance explained is expressed by numbers within parentheses.

