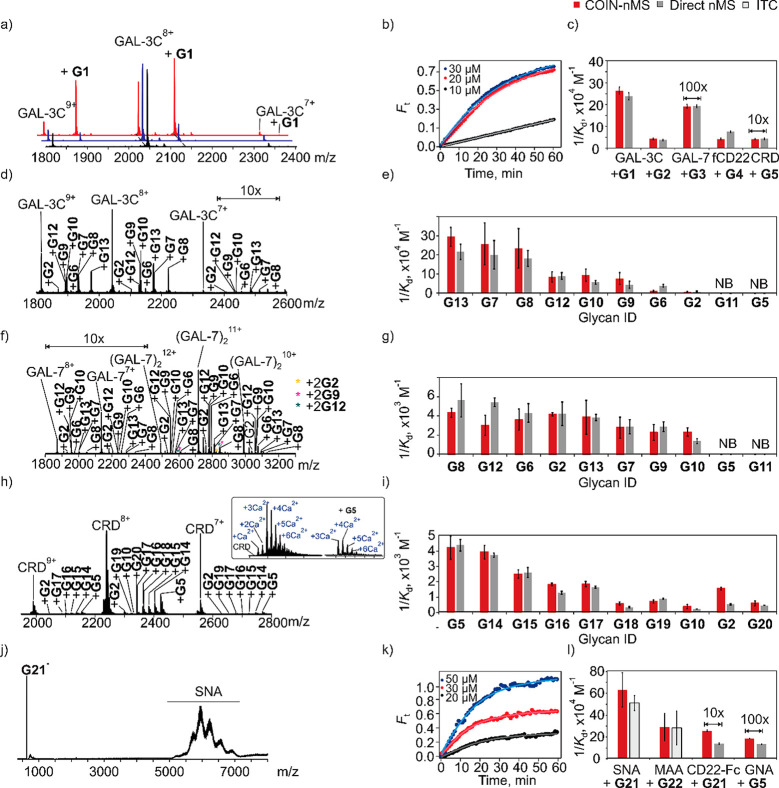
Figure 3.
GBP-glycan affinity measurements performed using (a–i) COIN-nMS and (j–l) COIN-CaR-nMS for the model systems. (a, b) Representative time-resolved mass spectra and fractional binding site occupancy (Ft) measured for GAL-3C (5 μM, Solutions 1 and 2) with G1 (20 μM, Solution 2). (c) Comparison of the values obtained by COIN-nMS (red) vs nMS (gray). (d–i) GBP-glycan affinity measurements performed using COIN-nMS and mixtures of glycans. Representative ESI mass spectra acquired in positive ion mode (d) GAL-3C (5 μM) and G2, G5, G6-G13, (f) GAL-7 (5.5 μM) and G2, G5, G6-G13, (h) the carbohydrate binding domain (CRD) of DC-SIGN (2 μM) and G2, G5, G10, G14-G20. Insets show magnified region of the mass spectra containing signal for DC-SIGN CRD and (CRD+G5) ions. (e, g, i) Comparison of the values obtained by COIN-nMS vs nMS. (j–l) GBP-glycan affinity measurements performed using COIN-CaR-nMS. Solid lines are the best fit of eq 12 to the experimental data. (j) Representative mass spectrum measured by CaR-ESI-MS for an ammonium acetate solution (200 mM, pH 6.9) of SNA (5 μM) and G22 (0.1 μM), collision energy (CE) 40 V. (k) Time-resolved relative abundance of released G22 ion normalized to total SNA signal for COIN-CaR-ESI-MS experiments performed on ammonium acetate solution (200 mM, pH 6.9) of SNA (5 μM) and G22 (0.1 μM) (Solution 1) and SNA (5 μM) and G22 (20, 30, and 50 μM) (Solution 2). (l) Comparison of the values obtained by COIN-nMS (red) vs nMS (gray) or ITC (light gray). Solid curves represent the best fit of eq 13 to the experimental data. All measurements were performed in ammonium acetate solutions (200 mM, pH 6.9, 25 °C) except for DC-SIGN CRD (ammonium acetate, 200 mM, pH 7.4, Ca(CH3COO)2 2.5 mM, 25 °C).

