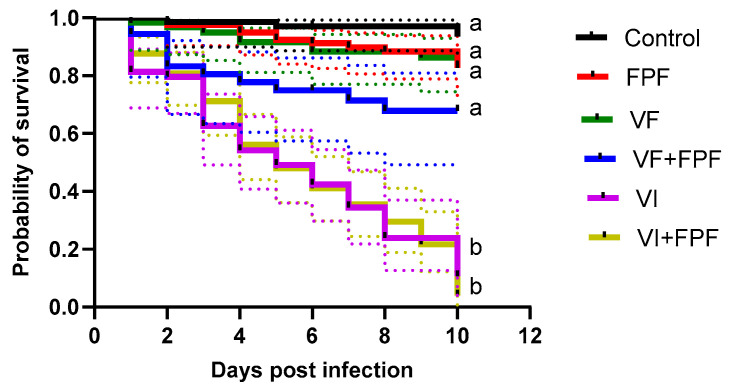
Figure 1.
Kaplan–Meier survival curves (solid colored lines) in days post-infection and 95% Cis for each fitted curve (dotted colored lines) of the impact of insecticide (FPF) and RNA viruses (BQCV/SBV) on adult honey bees inoculated orally (VF) or through injection (VI), alone or in combination with FPF. Bees (n = 25 bees per cage, n = 3 cages per treatment) were either injected with one µL inoculum containing 108 and 1010 genome equivalents for BQCV and SBV, respectively, or fed 10 µL of sugar syrup containing the same concentrations of viruses on day 0 and subsequently fed with a sublethal (chronic) concentration of FPF (4.3 µg mL−1) or a control sugar solution. Pathogens were inoculated once at day 0, while FPF was provided ad libitum throughout the experiment. Different lowercase letters indicate statistically significant differences at α = 0.05 in a Cox proportional hazard mixed-effect model, followed by post hoc Tukey tests (with Bonferroni correction for multiple comparisons). For the statistical details, see Table 1.

