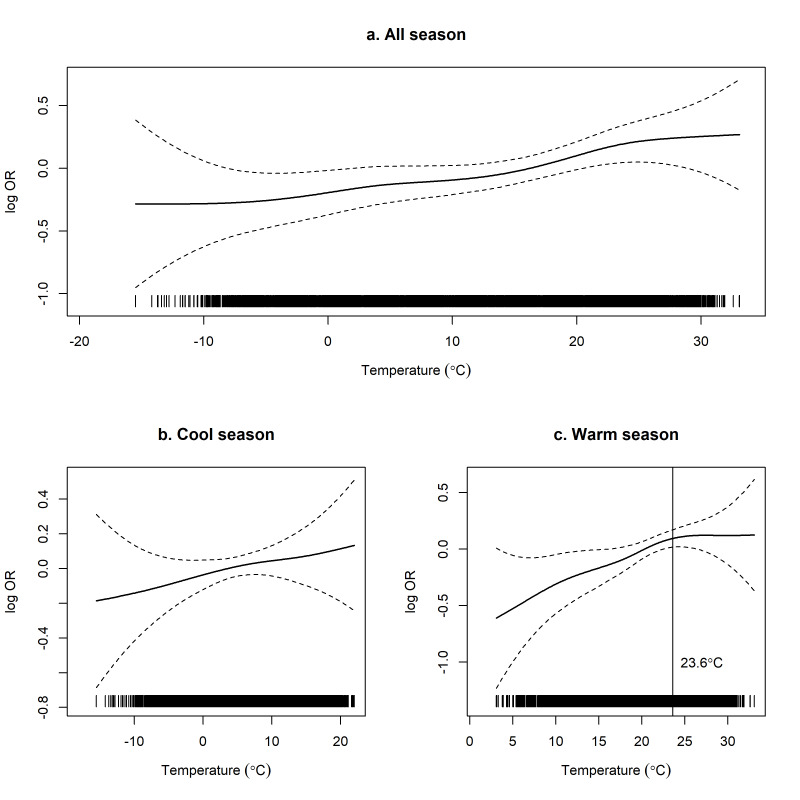
Figure 2.
Exposure-response curve between the ambient temperature and assault deaths after controlling for humidity in Seoul, South Korea, between 1991 and 2020 in a. all seasons, b. the cool season (October–March), and c. the warm season (April–September). The solid lines represent the estimated log-odds ratios of the temperature variable, and the dotted lines represent the 95% confidence intervals. The solid vertical lines at the bottom of each figure indicate the reference values for each temperature value, which were used as the baseline for the log-odds ratio estimates.

