Fig. 1.
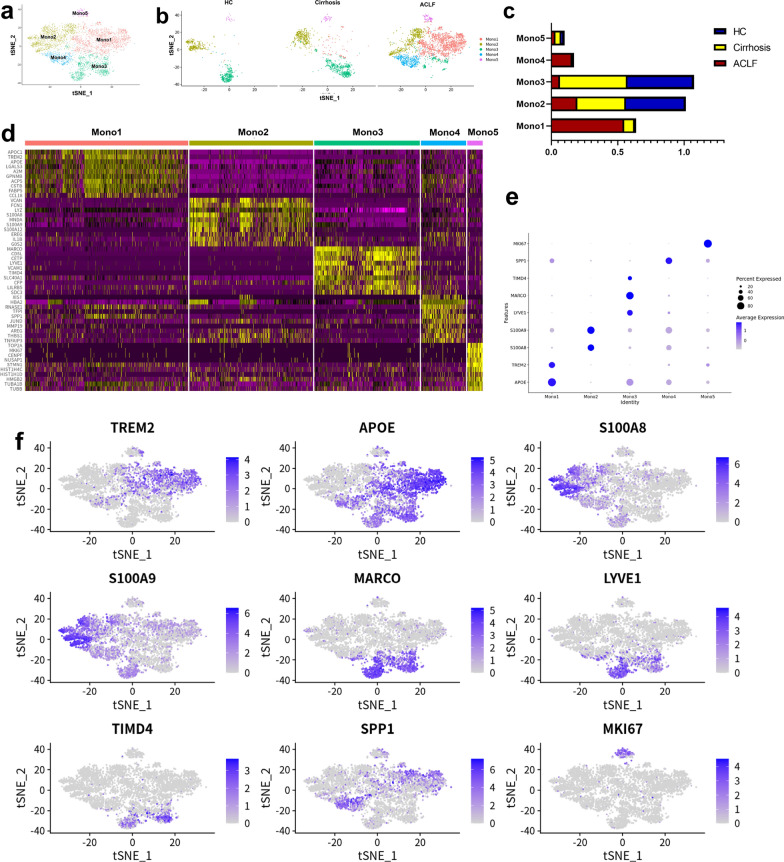
The scRNA-seq analysis of monocytes/macrophages in the livers. a 4738 monocytes/macrophages in the livers were re-clustered into 5 clusters according to their gene expression using Seurat v4.0 and the result was shown by tSNE. b The distribution of 5 monocytes/macrophages clusters among HCs, cirrhosis and ACLF patients. Clusters Mono1 and Mono4 were characteristically enriched in ACLF livers. c The proportions of 5 monocytes/macrophages clusters among HCs, cirrhosis and ACLF patients. The HCs and cirrhosis patients had similar proportions of each cluster, while the ACLF patients had high proportions of Mono1. d The heat map of the DE genes for each cluster. e The dotplot of the representative marker genes for each cluster. f The tSNE plots of marker genes for each cluster

