Fig. 2.
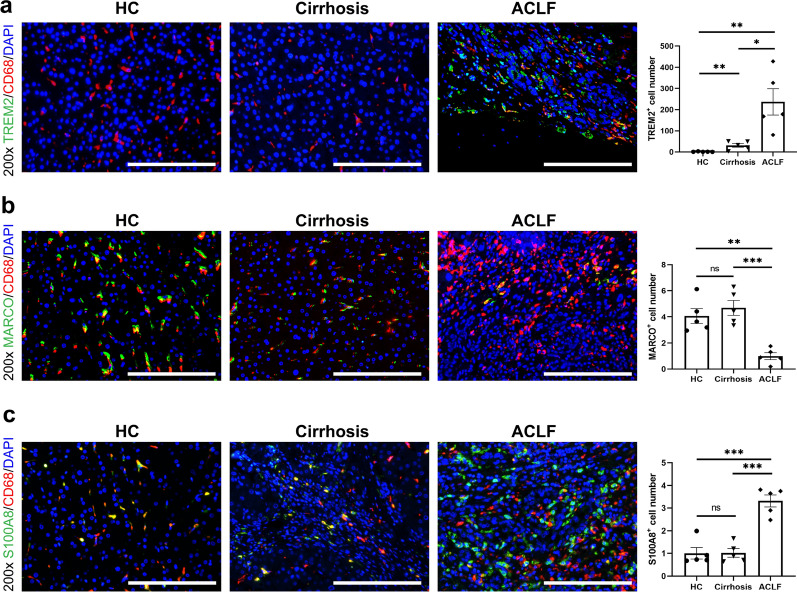
The representative immunofluorescence images of monocytes/macrophages clusters in the livers of HCs, cirrhosis and ACLF patients. a The immunofluorescence images (n = 5) of CD68 (red), TREM2 (green) and DAPI (blue) in the livers. The ACLF patients had much higher number of TREM2+ cells in the livers compared with HCs and cirrhosis patients. b The immunofluorescence images (n = 5) of CD68 (red), MARCO (green) and DAPI (blue) in the livers. The HCs and cirrhosis patients had similar number of MARCO+ cells, while the ACLF patients showed significant decrease of them. c The immunofluorescence images (n = 5) of CD68 (red), S100A8 (green) and DAPI (blue) in the livers. The ACLF patients had higher number of S100A8.+ cells in the livers compared with HCs and cirrhosis patients. For all images, the positive signal number of each sample was determined by the mean value of the TREM2/MARCO/S100A8 positive signals in five random fields after data standardization. (ns not significant, *p < 0.05, **p < 0.01, ***p < 0.001, bar = 200 μm)

