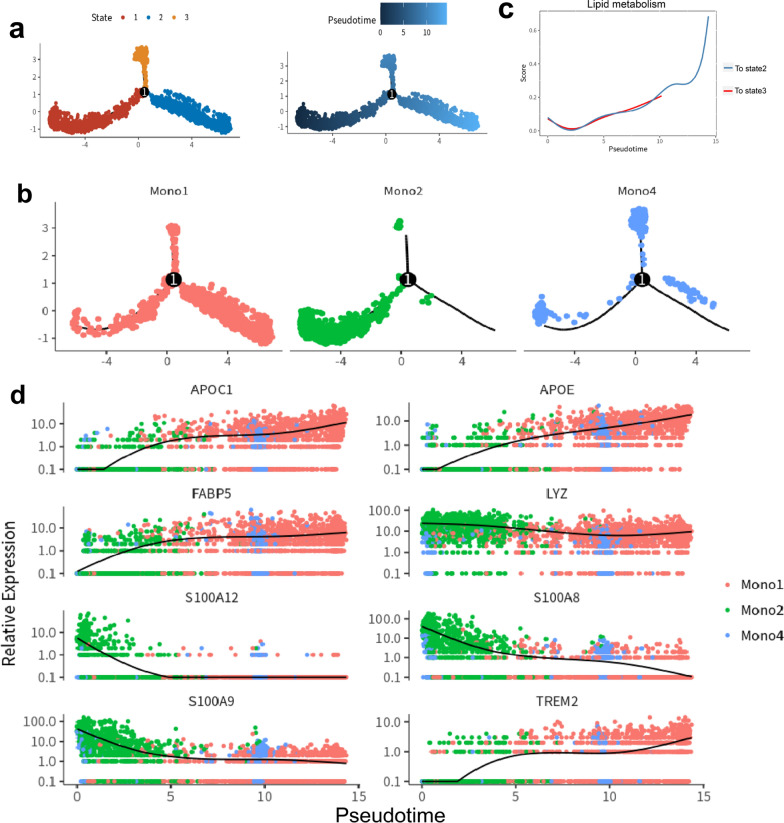
Fig. 5.
The pseudotime analysis of monocytes/macrophages. a The pseudotime trajectory of Mono1, Mono2 and Mono4. All cells were clustered into 3 states. The No.1 point represent as the differentiation point in pseudotime differentiation. b The distribution of monocytes/macrophages clusters in the pseudotime trajectory. Mono2 was at the beginning of the trajectory path, and the majority cells of clusters Mono1 and Mono4 were at the terminals of the bifurcation, respectively c Changes in lipid metabolism scores along the direction of pseudotime trajectory. d The expression of key genes along the pseudotime trajectory. Genes related to lipid metabolism, including APOC1, APOE, FABP5 and TREM2 were increased, while genes related to inflammation, including LYZ, S100A12, S100A8 and S100A9 were decreased

