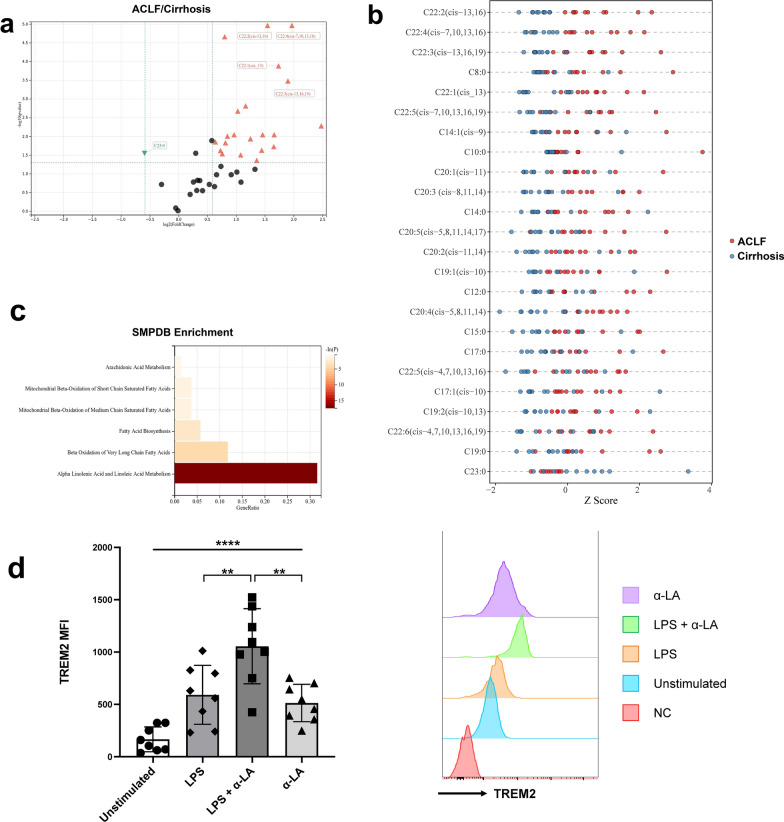
Fig. 6.
The targeted lipid metabolomics in the livers of cirrhosis and ACLF patients and stimulation test with α-LA. a The volcano plot of FFAs in the livers showed as the ACLF group over the cirrhosis group. 23 FFAs were increased in ACLF group while only 1 FFA was increased in cirrhosis group. b The 24 differentiated FFAs for each sample shown by Z score. c The metabolite sets enrichment analysis for the increased FFAs in ACLF livers. d The expression of TREM2 on selected CD14+ peripheral monocytes stimulated in vitro. The expression of TREM2 was significantly increased when stimulated with α-LA (60 μM) and LPS (100 ng/mL). (**p < 0.01, ****p < 0.0001, tested by paired t-test)

