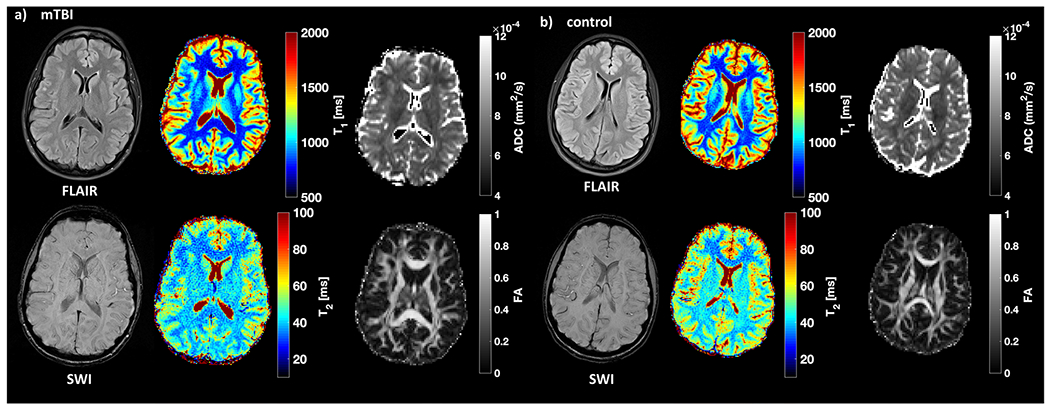
Fig. 3.

Examples of qualitative and quantitative images from a patient with mTBI and a matched control. Fluid-attenuation inversion recovery (FLAIR) and susceptibility-weighted images (SWI) as well as T1, T2, ADC, and FA maps from a 34-year-old female patient (a) at timepoint 1 and a 30-year-old female (b) control. Note the stark T1 and T2 difference between gray and white matter
