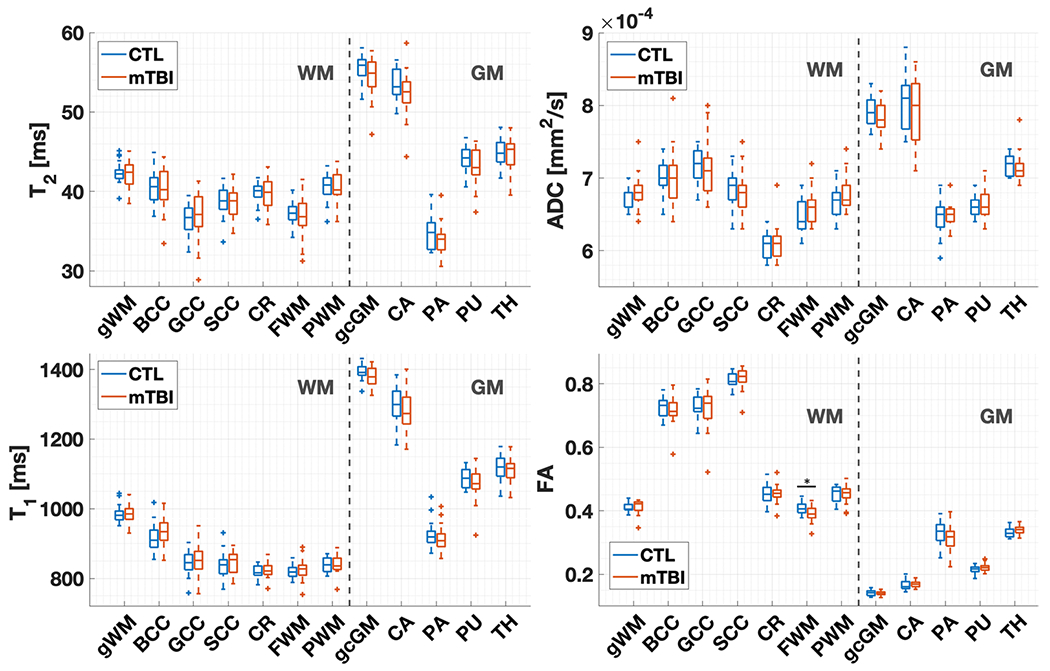
Fig. 4.

T2, T1, ADC, and FA distributions in mTBI (n = 19) and controls (n = 18) (CTL) at timepoint 1. As in the statistical analysis, the boxplots exclude the three non-age-matched patients. Note that T1 and T2 in mTBI did not differ from controls for any region. Compared to controls, FA in patients was lower in the frontal white matter (Mann–Whitney test, p < 0.05). The middle line in the boxes depicts the median value, and the boxes’ top and bottom edges the 25th and 75th percentiles of the data, respectively. The whiskers extend to the most extreme data points not considering outliers (95% of data), which are depicted by a plus sign. BCC body of corpus callosum, SCC splenium of the corpus callosum, GCC genu of the corpus callosum, FWM frontal white matter, PWM posterior white matter, CR corona radiata, CA caudate, PA pallidum, PU putamen, TH thalamus
