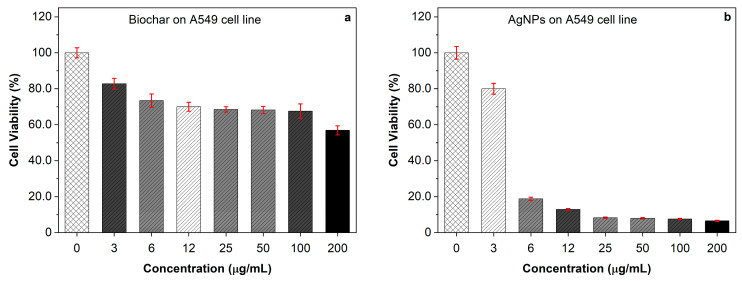
Figure 5.
The antiproliferative activity of (a) increasing concentrations of biochar and (b) increasing concentrations of AgNPs on the A549 cell line evaluated by MTT assay. The results represent the percentage of cell viability under different concentrations of biochar and AgNPs. All results are expressed as the mean of the three measurements ± SD (n = 3–4 independent replicates).

