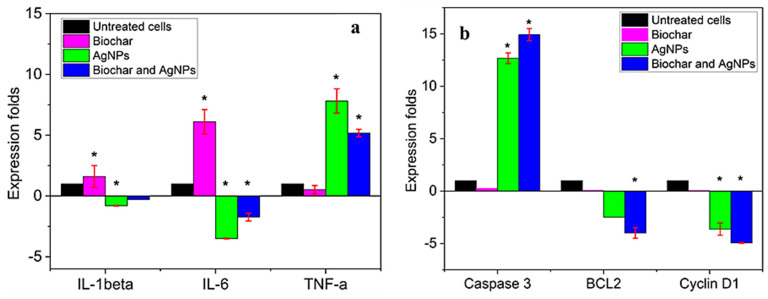
Figure 7.
Effect of AgNPs and biochar on the (a) expression of caspase 3, BCL-2, and Cylin D1 in the A549 cell line (cells were treated with biochar using the IC50 value and 3 µg/mL of AgNPs) (b) the expression of IL-1beta, IL-6, and TNF alpha in the A549 cell line (cells were treated with biochar using the IC50 value and 3 µg/mL of AgNPs). All results are expressed as means of three dependent replicates ± SD. *: p < 0.05, compared to control untreated cells.

