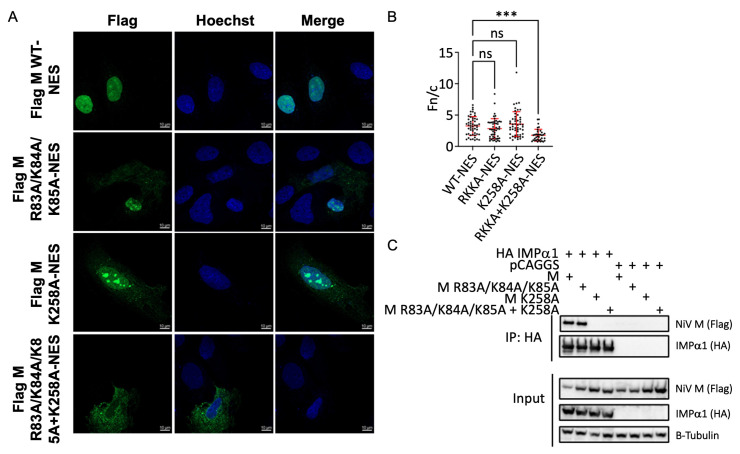
Figure 4.
NiV M NLS1 and NLS2 contribute to NiV M nuclear import. (A) Confocal microscopy images of Huh7 cells transfected with flag-tagged NiV M-NES plasmids. Following transfection, cells were stained with Hoechst 33,342 and an anti-Flag antibody conjugated to AlexaFluor488. Images were captured using a Zeiss LSM 800 confocal microscope. (B) Quantitation of average nuclear fluorescence over average cytoplasmic fluorescence (Fn/c). Fn/c was calculated using the Biotek Cytation 5. Data are represented as mean fn/c for each sample ± SD. NS denotes p value > 0.05. *** denotes p values ≤ 0.001. (C) Co-IP assay measuring the interaction between HA-tagged IMPα1 and flag-tagged NiV M mutants (R84A/R84A/R85A, K258A, and R84A/R84A/R85A + K258A). Assays were performed as in Figure 3A–F.

