Figure 5.
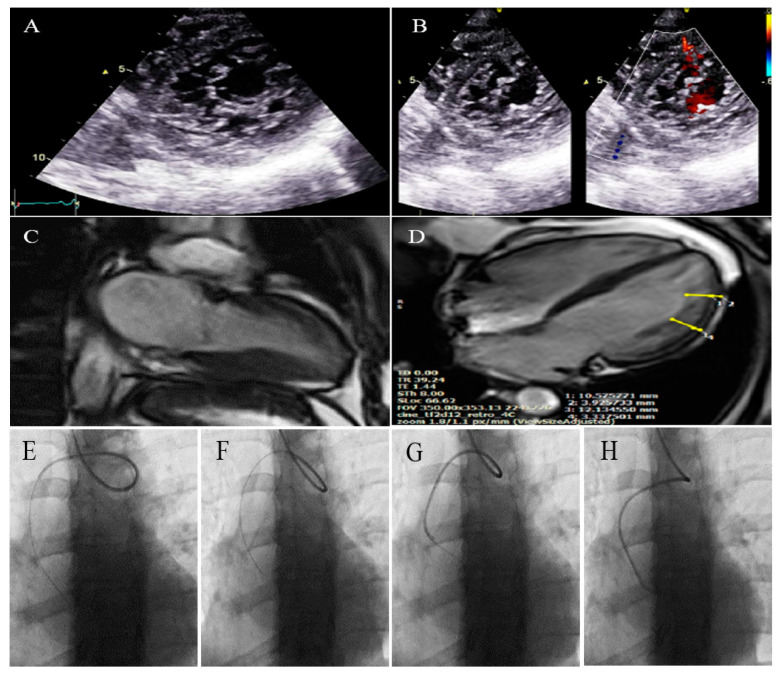
Two-dimensional transthoracic echocardiographic views of case #5. (A); Left ventricular apical SAX view illustrating hypertrabeculated apical portions in addition to deep intertrabecular recesses. (B); Color Doppler echocardiography, showing evidence of direct blood flow from the ventricular cavity into deep intertrabecular recesses. (C,D); Cardiac magnetic resonance imaging, illustrating a prominent trabecular network in lateral segments of the left ventricle (LV) and LV apex. The maximum end-diastole NC/C ratio (measured using long-axis images) was 2.7 in the apical lateral segment and 3.6 in the mid-anterolateral segment of LV. (E–H); Serial images of catheter course during coronary angiography via radial approach, illustrating the arteria lusoria or aberrant right subclavian artery.

