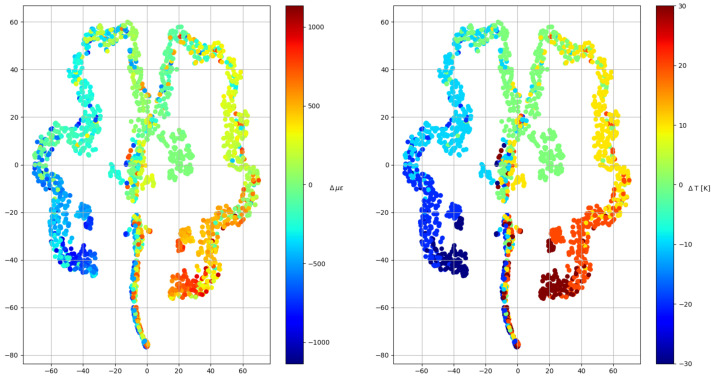
Figure 6.
Clustering algorithm results. The algorithm takes a vector with N dimensions and converts it into 2 dimensions, so that all the samples are represented in a plane. On the left, the samples are colored according to their strain increment and at right according to their temperature increment.

