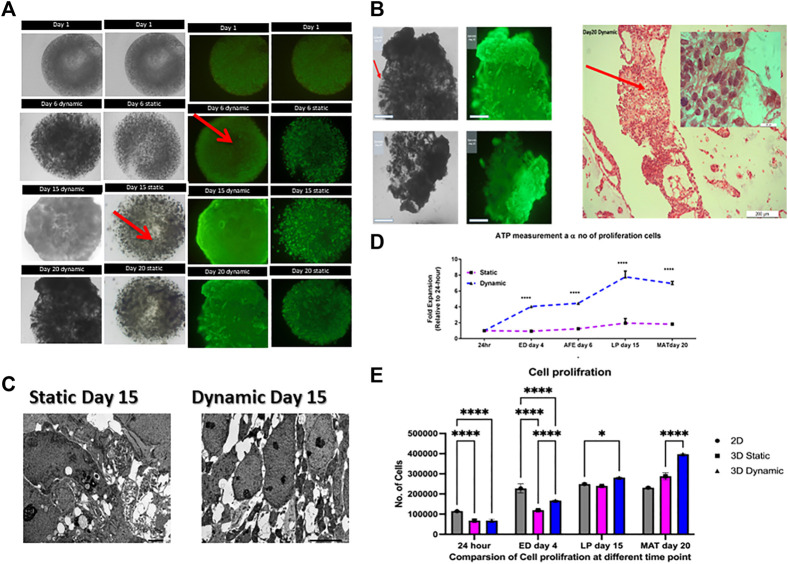
FIGURE 2.
Comparison of cell proliferation in static and dynamic 3D cultures. (A) Images of live/dead staining show increased cell growth throughout the differentiation process. Red arrows show the necrotic cores that occur under static conditions. Scale bar, 2 mm; (B) The image indicates that there was a high degree of movement, migration of initially immobilized cells, and formation of tissue-like structures in 3D dynamic culture by day 20. Representative images of hematoxylin and eosin-stained cells, their extracellular matrix formed tissue-like assemblies and the cells proliferated more in 3D dynamic conditions by day 20. Scale bars for 2 mm and 200 μm; (C) TEM of 3D cultures at day 15 revealed the presence of necrotic cells or apoptotic bodies (red arrows) and a heterogeneous cell population in static condition whereas no necrotic or apoptotic structures were found in the homogenous dynamically cultured cells. Scale bar, 5.0 µm. 3D, three-dimensional; IPSC, induced pluripotent stem cells; TEM, transmission electron microscopy. (D) Cell Titer Glo profile of encapsulated human IPSCs. Proliferation (normalized to day one, error bars show one standard deviation, n = 3 biological replicates. **** = p < 0.0001; (E) Proliferation plot based on the results of MTS assay assay. Cellular proliferation measured at different time point. All data represt the mean of there independent experiments. P-valueobtained by two way analysis of variance higher on ****p ≤ 0.0001, ***p ≤ 0.001, and **p ≤ 0.01.

