Figure 2.
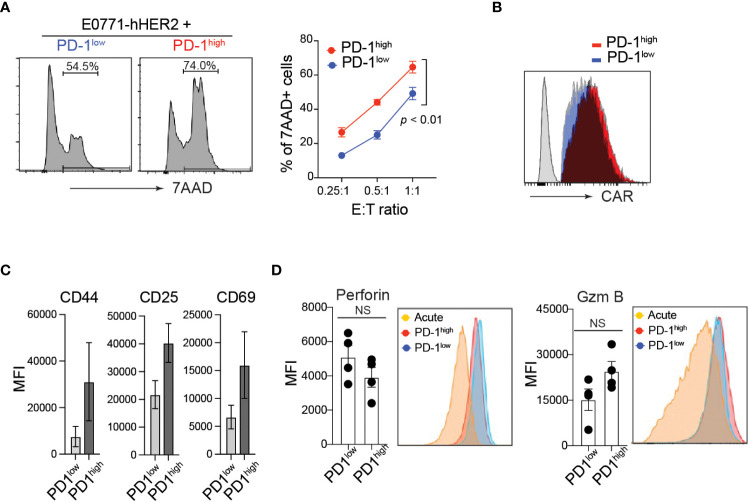
Elevated cytotoxicity of PD-1high CAR-T cells. (A) Representative flow cytometry analysis of CFSE-labeled hHER2-E0771 positive for 7-AAD staining after 16-hour co-culture with sorted PD-1high or PD-1low CAR-T cells (left) and quantification at stated effector to target ratios (right) from three independent experiments in triplicate is shown (mean +/- SEM). P value was determined by one-way ANOVA. (B) Representative flow cytometry data of surface hHER2-CAR expression on non-transduced T cells (gray) and PD-1low (blue)- or PD-1high (red)-CAR-T cells. (C) Flow cytometry MFI of CD44, CD25, and CD69 cell surface expression on PD-1high and PD-1low CAR-T cells from four independent experiments is depicted (mean +/- SEM). (D) Representative flow cytometry analysis of intracellular levels of perforin and Granzyme B in PD-1high and PD-1low CAR-T cells and MFI from 4 independent experiments is shown (mean +/- SEM). NS; not significant. P value was determined by unpaired, Student’s t-test.

