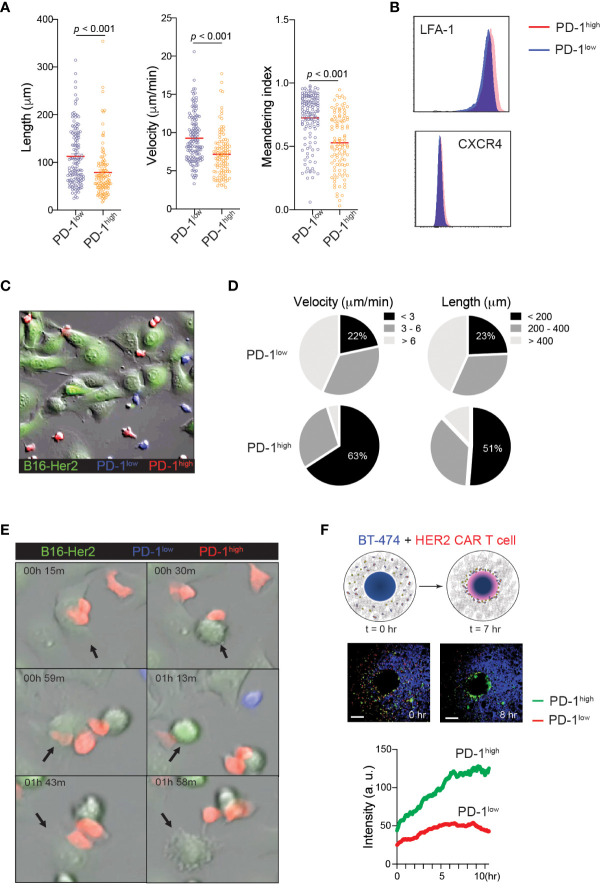
Figure 3.
Distinct motility patterns of PD-1high vs. PD-1low CAR-T cells. (A) Track length, velocity, and meandering index were calculated from PD-1high and PD-1low CAR-T cells migration on ICAM-1 and CXCL12 coated dishes. Data shown are representative results from one of 4 independent experiments. Solid red line indicates the mean, and P value was determined by unpaired, two-sided Student’s t-test. (B) Representative flow cytometry data showing surface expression of LFA-1 and CXCR4 on PD-1high and PD-1low CAR-T cells. (C) Time-lapse sequencing of PD-1high (red) and PD-1low (blue) CAR-T cells with hHER2-expressing B16F10 cells (green) was imaged every 30 seconds for 2 hours. (D) Velocity (left) and track length (right) for PD-1high and PD-1low CAR-T cells were quantified. Cell tracks for PD-1high and PD-1low CAR-T cells were stratified into slowest (<3 μm/min), middle (3-6 μm/min), and fastest (> 6 μm/min) migrating cells and shortest (<200 μm), middle (200-400 μm) and furthest (> 400 μm) migrators while in the presence of target cancer cells. (E) Selected still images from the cell migration movie 2 indicating cytotoxic events of PD-1high and PD-1low CAR-T cells targeting hHER2-B16F10 cancer cells on ICAM-1 and CXCL12 coated plates. (F) Schematic of in vitro 3D CAR-T cell migration assay. hHER2-CAR-T cells swarm to cognate tumoroids in Matrigel over time (upper). Still images from the movie showing the start point (0 hr) and 8 hours later showing increased engagement of PD-1high (green) CAR-T cells with BT474 tumoroids (middle). A single region of interest was drawn around the tumoroid, and mean fluorescence intensity was quantified for recruited PD-1high (green) and PD-1low (red) CAR-T cells over time (lower). Data represent 4 experiments with BT474 and HER2-B16 (mouse) tumoroids with similar results.

