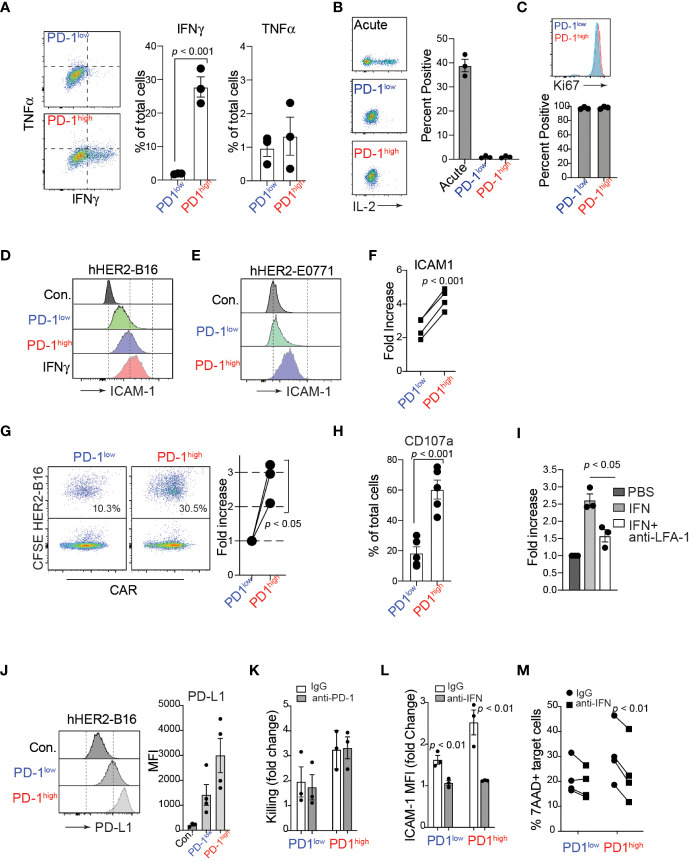
Figure 4.
IFNγ production of PD-1high CAR-T cells and enhanced engagement with target cancer cells. (A) Flow cytometry analysis of TNFα and IFNγ intracellular levels in PD-1high and PD-1low CAR-T cells after 4-hour co-cultures with target cancer cells in the presence of monensin (1:1000) and brefeldin A (1:1000). A representative experiment is shown from 3 independent experiments. On the right, quantification of the percent of PD-1high and PD-1low CAR-T cells producing TNFα and IFNγ is shown from 3 independent experiments performed in triplicate. P value was determined by unpaired, two-sided Student’s t-test. (B) Representative flow cytometry analysis (left) and quantification (right) of intracellular IL-2 staining after stimulation with plate-bound anti-CD3/CD28 antibodies for acute, PD-1low and PD-1high CAR T cells from 3 experiments performed in triplicate. (C) Representative flow cytometry analysis (upper) and quantification (lower) of intracellular Ki67 staining for sorted PD-1low and PD-1high CAR T cells from 3 independent experiments performed in triplicate. (D, E) Flow cytometry histograms of surface ICAM-1 expression on hHER2-B16 (D) and hHER2-E0771 (E) after 16 hour co-culture with PD-1high and PD-1low CAR-T cells, or with 100 ng/mL recombinant mouse IFNγ. (F) Quantification of the increase in hHER2-B16 ICAM-1 expression after co-culture with PD-1high and PD-1low CAR-T cells relative to untreated hHER2-B16 from 4 independent experiments in triplicate is shown. P value was determined by unpaired, two-sided Student’s t-test. (G) CAR-T cells were sorted on PD-1 expression and labeled with CellTrace FarRed and mixed with CFSE-labelled hHER2-B16 for 2 hours. Events double-positive for CellTrace FarRed and CFSE were measured using flow cytometry to assess the percent of CAR-T cells in conjugation with target hHER2-B16 (left). Quantification of the relative increase from PD-1low to PD-1high is shown on the right from 3 independent experiments. P value was determined by unpaired, two-sided Student’s t-test. (H) PD-1high and PD-1low CAR-T cells were cultured with CFSE-labelled target cancer cells for 4 hours in the presence of monensin (1:1000). The percent of cells positive for CD107a staining was measured for PD-1high and PD-1low CAR-T cells by flow cytometry from 5 independent experiments performed in triplicate. P value was determined by unpaired, two-sided Student’s t-test. (I) hHER2-B16 cells were treated with 100 ng/mL recombinant mouse IFNγ or PBS overnight. Cancer cells (CFSE) were used for the conjugation assay with CAR-T cells (CellTrace FarRed) in the presence or absence of anti-LFA-1 antibody. The fold increase in conjugation formation from PBS alone was quantified from 3 independent experiments. P value was determined by unpaired, two-sided Student’s t-test. (J) Representative flow cytometry histogram (left) and mean fluorescence intensity quantification (right) of surface PD-L1 expression on hHER2-B16 after coculture with PD-1low or PD-1high CAR T cells from 4 independent experiments performed in triplicate. (K) Quantification of target tumor cell killing relative to control T cells for PD-1low and PD-1high CAR T cells in the presence of 20 μg/mL anti-PD-1 antibody from 3 independent experiments performed in triplicate. (L) Quantification of the fold change in ICAM-1 MFI on target tumor cells after coculture with PD-1low or PD-1high CAR T cells with 20 μg/mL anti-IFNγ antibody from 3 independent experiments performed in triplicate. (M) Quantification of percent 7AAD+ target cancer cells after after coculture with PD-1low or PD-1high CAR T cells with 20 μg/mL anti-IFNγ antibody from 4 independent experiments performed in triplicate.

