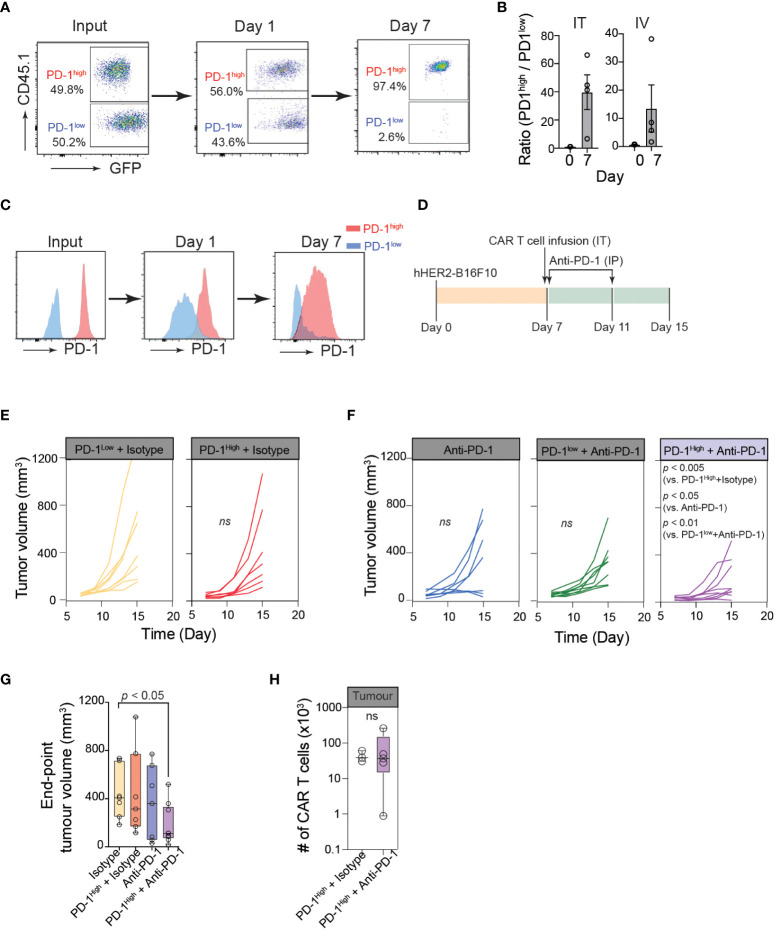
Figure 5.
Optimum cancer control by PD-1high CAR-T cells is achieved with PD-1 blockade. (A) Representative flow cytometric data showing PD-1high (CD45.1+GFP+) to PD-1low (GFP+) ratio at the time of injection (input), and the intratumoral PD-1high to PD-1low ratio 24 hours and 7 days post-intratumoral injection. (B) Quantification of PD-1high to PD-1low ratio at the time of injection (Day 0) and 7 days after both intratumoral injection (IT; left) or intravenous injection (IV; right) from 4 independent experiments. (C) Representative data of surface PD-1 expression for PD-1high and PD-1low CAR-T cells 1 day and 7 days post-intratumoral injection. (D) Schematic of experimental design for combination therapy. Mice were inoculated with hHER2-B16 on the mouse flank. PD-1high or PD-1low CAR-T cells were injected intratumorally on Day 7 and mice were given anti-PD-1 or isotype antibody injections I.P. on days 7 and 11. (E, F) Longitudinal tumor burden (volume, mm3) of hHER2-B16 tumor-bearing mice treated with 1x10⁶ PD-1high or PD-1low CAR-T cells (E) with or without a combination of 100 μg anti-PD-1 immune checkpoint blockade (F). Tumor volume was calculated using the following formula: (tumor lx tumor w2x0.52), and tracked every 2 days. Isotype only n=8, anti-PD-1 only n=7, PD-1high + isotype n=7, PD-1high + anti-PD-1 n=9. P value was determined by ordinary One-Way ANOVA with a Tukey’s multiple-comparison post-test. (G) Quantification of tumor volume 8 days after PD-1high CAR-T cell injection plus isotype or anti-PD-1 blockade, as well as isotype and anti-PD-1 alone. P value was determined by two-way ANOVA. (H) Quantification of intratumoral CAR-T cells per tumor for mice treated with PD-1high CAR-T cells treated with Isotype (n=3) or anti-PD-1 antibodies (n=4). P value was determined by unpaired, two-sided Student’s t-test.

