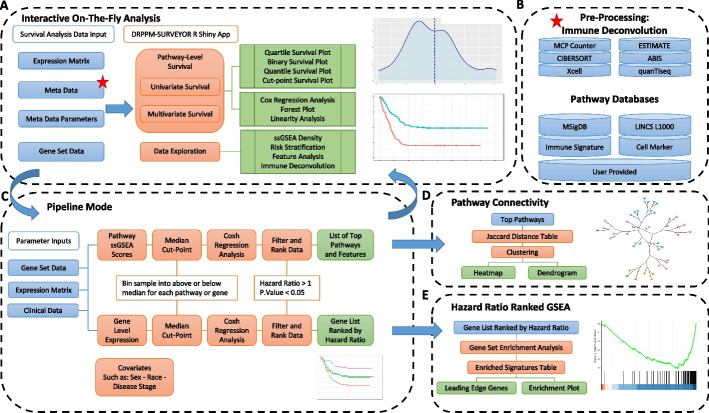
Fig. 1.
Schematic workflow of PATH-SURVEYOR: Pathway level survival enquiry for immune-oncology and drug repurposing. A In the On-The-Fly Shiny interface, users can provide a gene expression matrix matched with patient outcome meta information and a custom gene-set pathway. The shiny App will calculate a score for the selected pathway using a summary statistics, such as single sample gene set enrichment (ssGSEA), and dichotomized based on the median, optimum cut-point, quartiles, or user-specified cut-point. Univariate and multivariate Cox hazard regression analysis can be performed. B Several pathway databases are preloaded inside our app, including MsigDB, LINCS1000, and CellMarksDB. Additional patient features or immune deconvoluted features (Red Star Top Right) can be incorporated into a multivariate Cox hazard model and explored by our interface. C In the Pipeline mode, these scores were further dichotomized above and below the median ssGSEA score. A Cox regression analysis can be performed on each gene set to generate a comprehensive table of gene sets to filter according to significant, high-risk patients (hazard ratio > 1, P value < 0.05). A hazard ratio ranked gene list can be analyzed by GSEA (Bottom Right), and prioritized pathways can be visualized by pathway connectivity quantified by the Jaccard Index (Middle Right). Output of the analysis can be either a list of top pathways or gene list ranked based on hazard ratio. D Prioritized pathways can be visualized by pathway connectivity quantified by the Jaccard Index. E A hazard ratio ranked gene list can be analyzed by GSEA

