
Figure 1. Th2 signaling suppresses host defense of the skin against S. aureus.
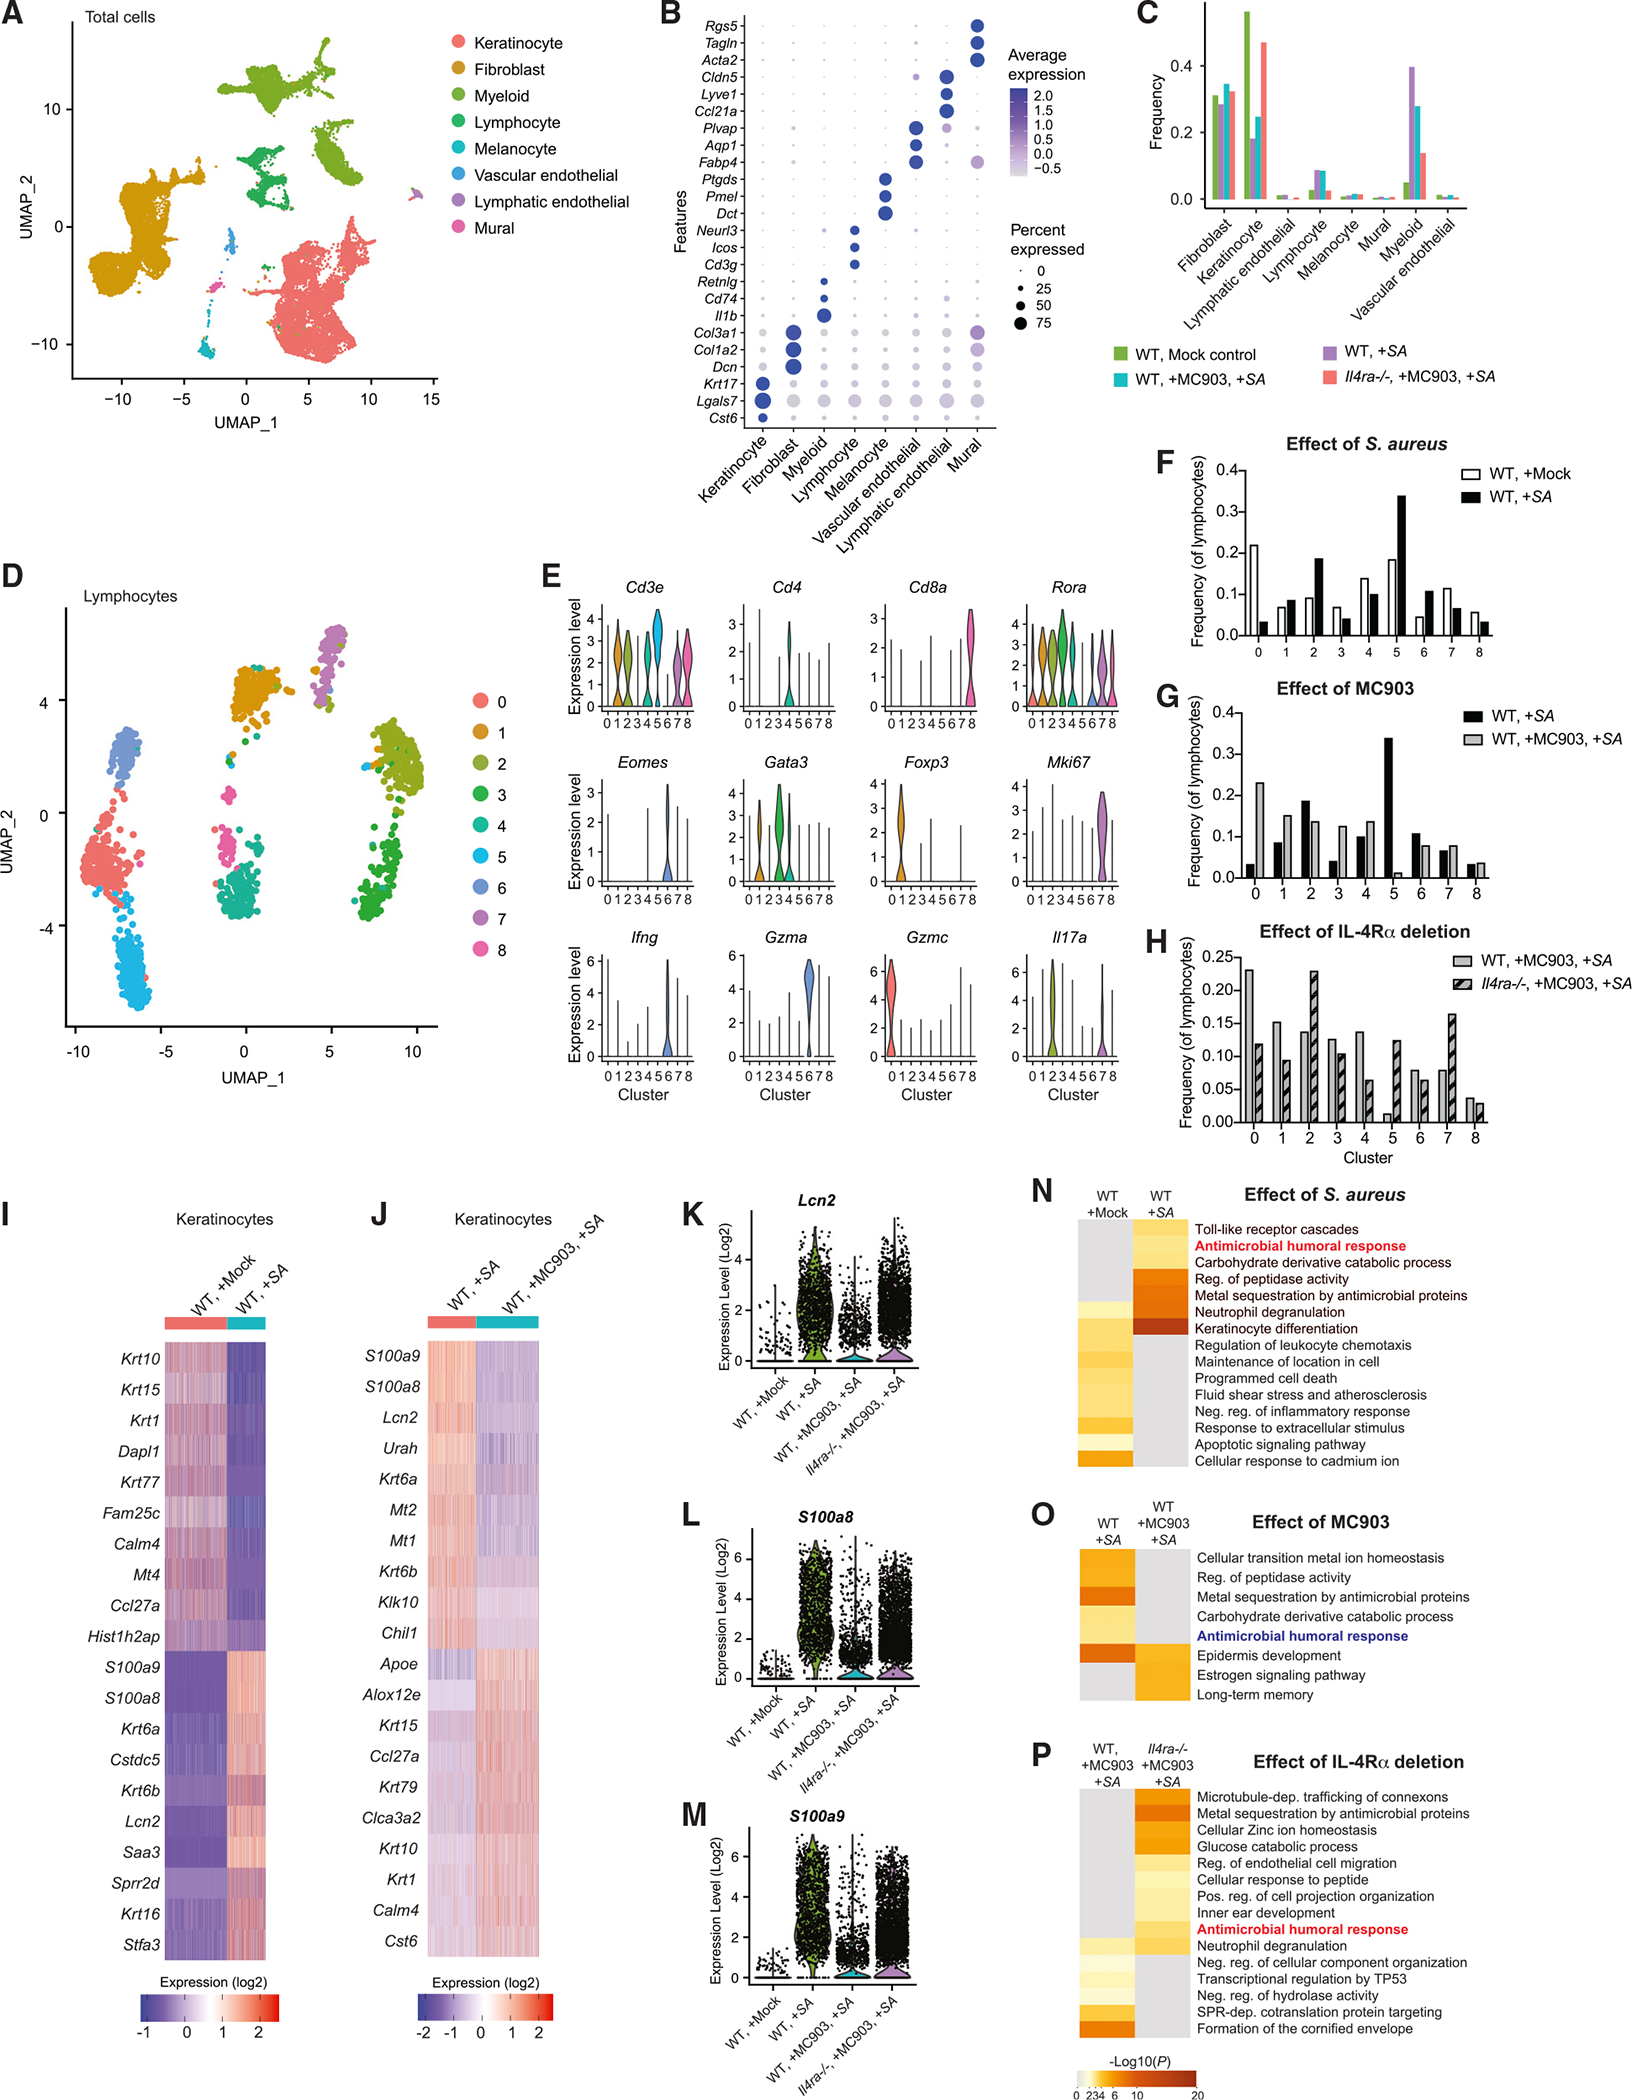
(A and B) Cell clusters identified by UMAP plot (A) based on expression of transcription markers (B) in non-inflamed skin of WT mice, inflamed skin of WT mice treated with S. aureus, WT mice treated with MC903 and S. aureus, or Il4ra−/− mice treated with MC903 and S. aureus.
(C) Frequency of the 8 major cell populations in the skin from mice treated as in (A) and (B).(C) UMAP plot of lymphocyte populations in the skin from mice treated as in (A) and (B).
(D) Violin plots of conserved lymphocyte marker gene expression in lymphocyte clusters.
(F–H) Comparison of relative abundance of lymphocyte clusters identified by UMAP plot.
(I and J) Heatmap of top 10 genes upregulated and downregulated in total keratinocyte populations by S. aureus application in WT mice (I) or after treatment of MC903 in WT mice that received S. aureus application (J).
(K–M) Gene expression of antimicrobial host defense genes, Lcn2 (K), S100a8 (L), and S100a9 (M), in keratinocyte populations from each indicated mouse group treated as in (A) and (B).
(N–P) Heatmap of selected Gene Ontogeny terms upregulated and downregulated in total keratinocyte populations by S. aureus application in WT mice (N), in mice treated with MC903 (O), and in the absence of IL-4Ra in mice treated by MC903 and S. aureus (P).
All data in this figure were obtained from 10,000 live cell suspensions pooled equally from five 8 mm punch biopsies of mice independently treated in each group (n = 5). Data were obtained from a single scRNA-seq run.