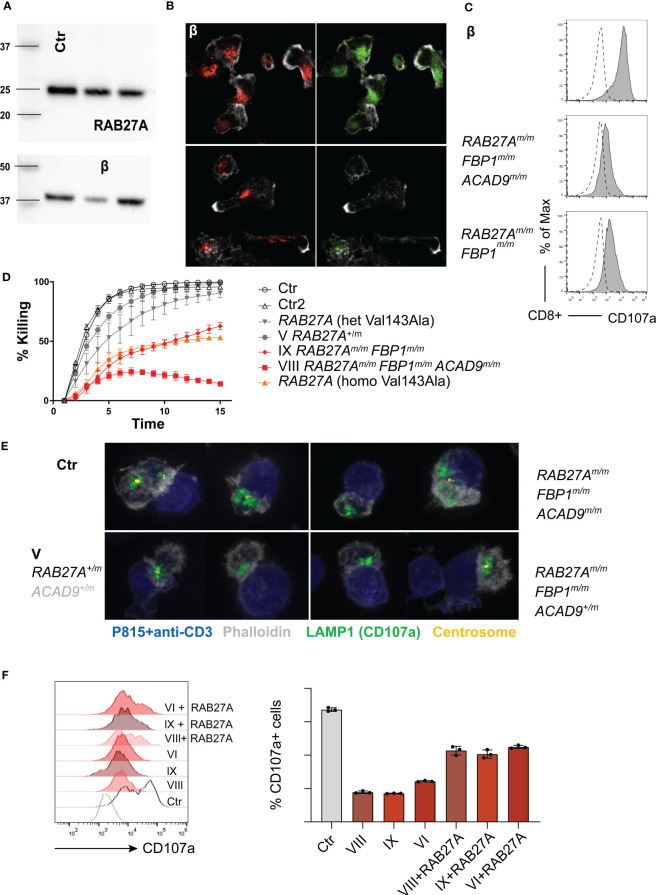
Figure 6.
Degranulation, cytotoxicity and granule polarization of T cell lines (A) Representative western blot (n=3) of RAB27A protein expression levels in control or patient derived T cell lines 10 days after re-stimulation. (B) Representative immunofluorescence microscopy of T cell lines: RAB27A (green) LAMP1 (red), actin (phalloidin in grey) (n=2). (C) Degranulation in cytotoxic T cell lines post stimulation with medium (dotted line) or 1μg/ml plate bound anti-CD3 (grey, solid line) measured by CD107a staining in culture. (D) Cytotoxicity was analyzed by killing of red-fluorescent target cells, visualized using an Incucyte microscope Controls and RAB27A Val431Ala patients were described before (14). (E) Granule polarization by immunoflourescence staining. anti-CD3 coated target cells (blue), granules (anti-LAMP1/CD107a, green), actin (phalloidin, grey) and centrosome (yellow). (F) Representative granule exocytosis of cytotoxic T cells from patients VIII, VI (n=3) and IX (n=1). T cells were virally transduced with RAB27A-GFP or left untreated. CD107a is shown of CD8+RAB27A-GFP+ cells or CD8+ cells after stimulation with anti-CD3 coated P815 cells. m, mutated; +, wildtype.

