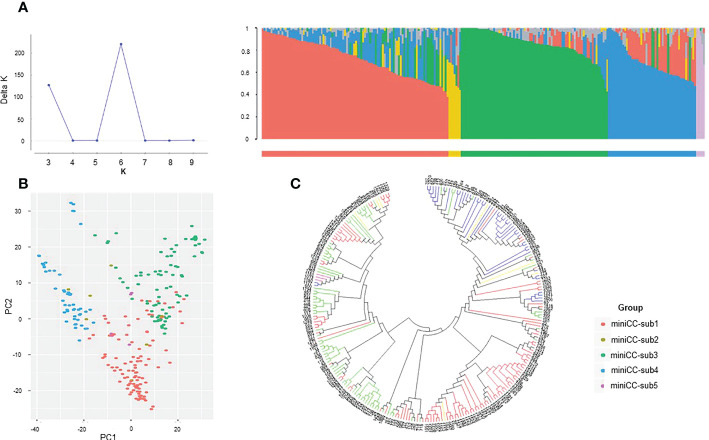
Figure 3.
Population structure analysis of K-wheat mini-core collection using SNP markers. (A) Results of Evanno test and population structure of the mini-core collection. (B) Principal component analysis (PCA) of a mini-core collection based on SNP markers. Based on the subpopulation structures, the red, yellow, green, blue, and purple dots represent mini-sub 1, mini-sub 2, mini-sub 3, mini-sub 4, and mini-sub 5, respectively. (C) Molecular phylogenetic analysis by Maximum Likelihood method using the mini-core collection. Phylogenetic analysis was inferred by the Maximum Likelihood method based on the Tamura-Nei model. Phylogeny tree analyses were conducted by MEGA7 (Kumar et al., 2016). Based on the subpopulation structures, the red, yellow, green, blue, and purple lines indicate mini-sub 1, 2, 3, 4, and 5, respectively.

