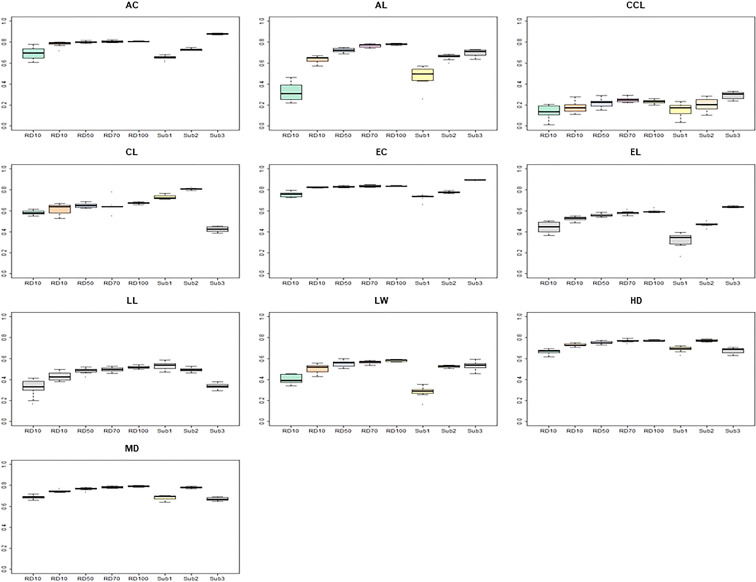
Figure 7.
Comparison of prediction accuracy according to compartmentalized training populations. The y-axis is the prediction accuracy, and the x-axis is each training population. The predictive model used for this analyses is RF. AC, awn color; AL, awn length; CCL, culm color; CL, culm length; EC, ear color; LW, leaf width; HD, days to heading; MD, days to maturity.

