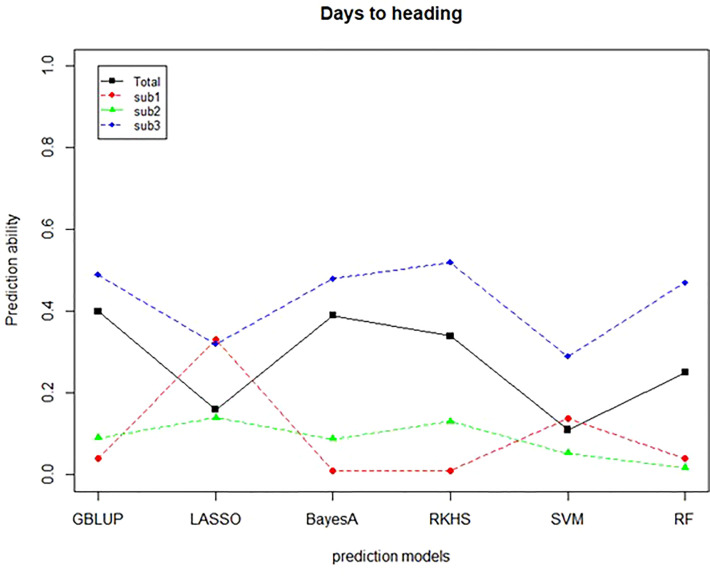
Figure 8.
Prediction ability of validation population for days to heading. The predictive ability of six predictive models was verified using four TPs. The X-axis means the prediction model, and the y-axis means the predictive ability confirmed through the comparison between GEBV and BLUP. The black line indicates CC, the red dotted line indicates CC-sub1, the green dotted line indicates CC-sub2, and the blue dotted line indicates CC-sub3.

