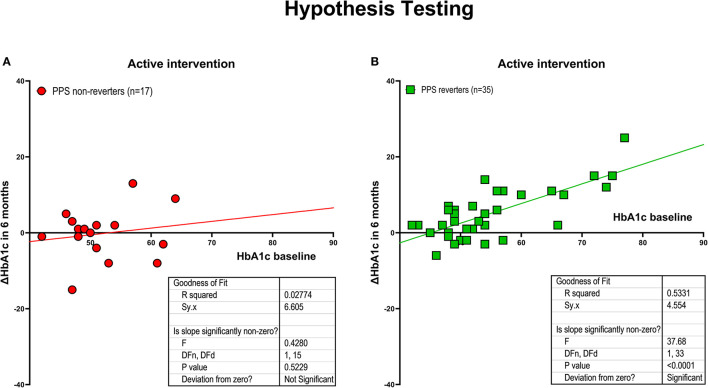
Figure 2.
Hypothesis testing. Intervention effect measured as the relation between changes in HbA1c after 6 months of intervention and baseline HbA1c, for individuals randomized to active treatment group, including individuals who experienced a predefined minimum reduction of PPS ≥ 15 during the intervention period (i.e., PPS reverters; N = 35), and individuals without this reduction (PPS non-reverters; N = 17). (A) PPS non-reverters. (B) PPS reverters (between-group difference significant at P < 0.003). Regarding HbA1c change depicted on the y-axis, a positive value reflects a reduction in HbA1c.

