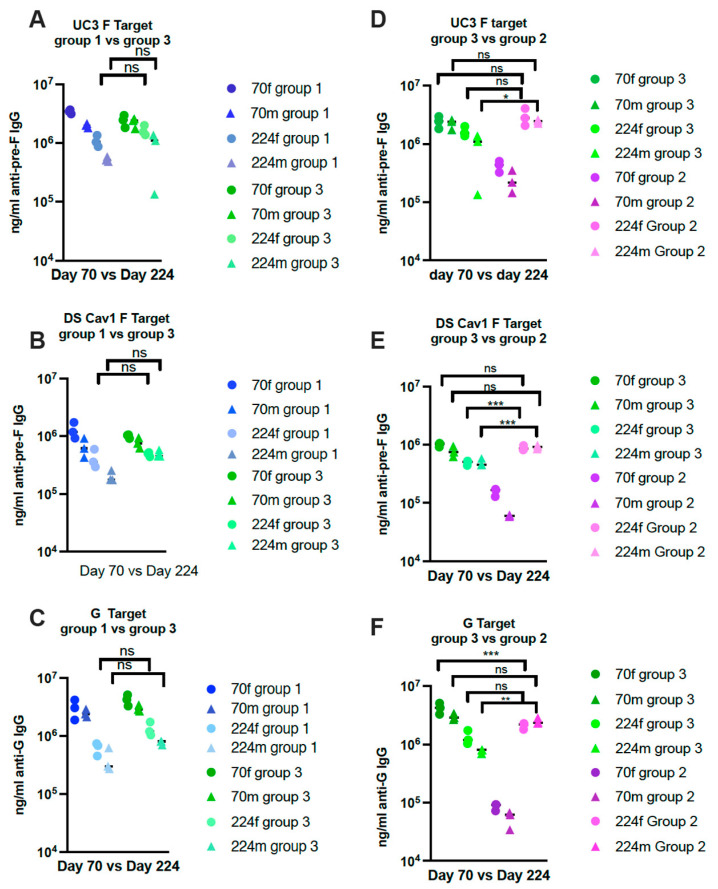
Figure 4.
Comparisons of IgG titers between key groups in Protocol 2. Comparisons of titers of anti-pre-F IgG or anti-G IgG in groups 1 and 3 on days 70 and 224 (two weeks after immunization) are shown in (A–C) using soluble UC-3 F (A) or soluble DS-Cav1 F (B) or soluble G protein (C). (D–F) show comparisons of IgG ELISA titers at day 70 vs. 224 in groups 2 and 3 animals using soluble UC-3 F (D) or soluble DS-Cav1 F (E) or soluble G protein (F). The statistical significance between key time points was determined by one-way ANOVA with a Tukey multiple comparison test. Circles: females; triangles: males.* p < 0.02; ** p < 0.005; *** p < 0.0005; ns: non-significant.

