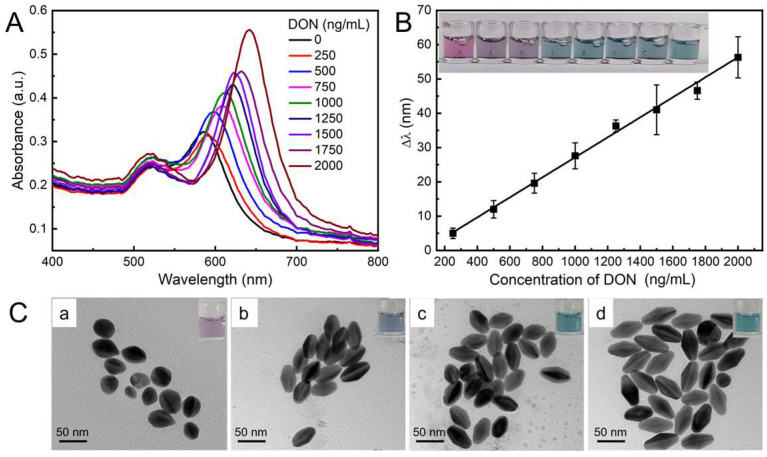
Figure 5.
(A) UV–vis absorption spectra of Au NBPs in response to various concentrations of DON from 0 to 2000 ng/mL. (B) Linear relationship between Δλ and the concentration DON, the insets show the color tonality variations. (C) Typical TEM images of Au NBPs in the presence of DON from 0 (a), 500 (b), 1000 (c), and 2000 ng/mL (d), respectively. The insets show the optical photographs of the corresponding colloidal solutions.

