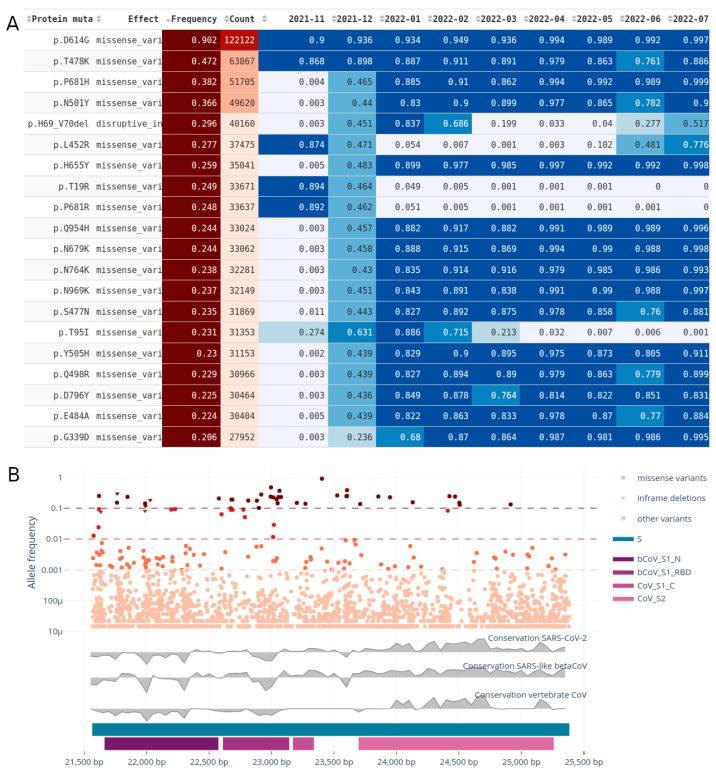
Figure 5.
Gene view for the spike protein on the raw read dataset. (A) Table of the top 20 recurrent mutations with the frequency segregated by month between November 2021 and July 2022; (B) gene view showing mutations (synonymous and unique mutations excluded) in the spike protein and their frequencies in the virus population, the ConsHMM conservation tracks in grey and the Pfam protein domains in tones of purple. See Figure S4 for a screenshot including the filters.

